Concept explainers
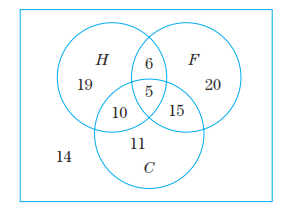
Family Library The Venn diagram in Fig. 10 classifies the 100 books in a family’s library as hardback

Figure 10
How many books are paperback nonfiction children’s books?
Want to see the full answer?
Check out a sample textbook solution
Chapter 5 Solutions
Finite Mathematics & Its Applications (12th Edition)
Additional Math Textbook Solutions
Pathways To Math Literacy (looseleaf)
Precalculus: Mathematics for Calculus (Standalone Book)
Precalculus
Elementary Statistics: Picturing the World (7th Edition)
Finite Mathematics for Business, Economics, Life Sciences and Social Sciences
Precalculus: A Unit Circle Approach (3rd Edition)
- (6) ≤ a) Determine the following groups: Homz(Q, Z), Homz(Q, Q), Homz(Q/Z, Z) for n E N. Homz(Z/nZ, Q) b) Show for ME MR: HomR (R, M) = M.arrow_forwardAlready got wrong chatgpt answer Plz don't use chatgpt answer will upvote otherwise leave it .arrow_forwardy=f'(x) 1 8 The function f is defined on the closed interval [0,8]. The graph of its derivative f' is shown above. How many relative minima are there for f(x)? O 2 6 4 00arrow_forward
- 60! 5!.7!.15!.33!arrow_forwardUse Euler's summation formula to prove that, for x > 2, Σ log n n3 = A log x 2x2 n≤x where A is a constant. - 1 +0 4x2 log x x3 "arrow_forward• • Let > be a potential for the vector field F = (−2 y³, −6 xy² − 4 z³, −12 yz² + 4 2). Then the value of sin((-1.63, 2.06, 0.57) – (0,0,0)) is - 0.336 -0.931 -0.587 0.440 0.902 0.607 -0.609 0.146arrow_forward
- 1. If f(x² + 1) = x + 5x² + 3, what is f(x² - 1)?arrow_forward2. What is the total length of the shortest path that goes from (0,4) to a point on the x-axis, then to a point on the line y = 6, then to (18.4)?arrow_forwardThe value of cos(4M) where M is the magnitude of the vector field with potential ƒ = e² sin(лy) cos(π²) at x = 1, y = 1/4, z = 1/3 is 0.602 -0.323 0.712 -0.816 0.781 0.102 0.075 0.013arrow_forward
 Glencoe Algebra 1, Student Edition, 9780079039897...AlgebraISBN:9780079039897Author:CarterPublisher:McGraw Hill
 Algebra: Structure And Method, Book 1AlgebraISBN:9780395977224Author:Richard G. Brown, Mary P. Dolciani, Robert H. Sorgenfrey, William L. ColePublisher:McDougal Littell
 Holt Mcdougal Larson Pre-algebra: Student Edition...AlgebraISBN:9780547587776Author:HOLT MCDOUGALPublisher:HOLT MCDOUGAL
- Algebra & Trigonometry with Analytic GeometryAlgebraISBN:9781133382119Author:SwokowskiPublisher:Cengage


