Problems 51–58 refer to the following slope fields: Figure for 51–58 57. Use a graphing calculator to graph y = 1 – Ce − x for C = −2, −1, 1, and 2, for − 5 ≤ x ≤ 5, −5 ≤ y ≤ 5, all in the same viewing window. Observe how the solution curves go with the flow of the tangent line segments in the corresponding slope field shown in Figure A or Figure B.
Problems 51–58 refer to the following slope fields: Figure for 51–58 57. Use a graphing calculator to graph y = 1 – Ce − x for C = −2, −1, 1, and 2, for − 5 ≤ x ≤ 5, −5 ≤ y ≤ 5, all in the same viewing window. Observe how the solution curves go with the flow of the tangent line segments in the corresponding slope field shown in Figure A or Figure B.
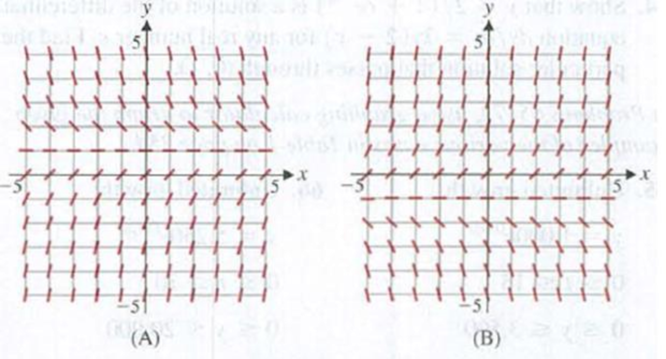
Solution Summary: The author explains how to draw the graph of the general solution of y=1-Ce-x for the differential equation for C=-2,1 and 2
Problems 51–58 refer to the following slope fields:
Figure for 51–58
57. Use a graphing calculator to graph y = 1 – Ce−x for C = −2, −1, 1, and 2, for − 5 ≤ x ≤ 5, −5 ≤ y ≤ 5, all in the same viewing window. Observe how the solution curves go with the flow of the tangent line segments in the corresponding slope field shown in Figure A or Figure B.
. Find the equation of the line passing through the point (7, 2) andperpendicular to the line 5y = 9 – 2x
1. Find an equation of a curve, such that at each point (x, y) on the curve, the slope
equals twice the square of the distance between the point and the y-axis and the
point (-1,2) is on the curve. *
1. Use a calculator to perform the indicated operations (Round to 2 decimal places as needed):
15.1931.4(15.6) + 13.87 ÷ 2.34
2. Write an equation for the line shown to the right.
AY
10
6
2-
+
10 -8
-4 -2
2.
10
--2-
-4
-8-
-10-
3. Let C be the cost (in dollars) to buy A apples.
a) Identify the independent variable. Give the letter and description of the variable.
b) Identify the dependent variable. Give the letter and description of the variable.
c) Interpret the ordered pair (12, 6) in terms of the application?
4. The lowest elevation in a region is at the bottom of a valley (-252 ft), and the hest elevation is at the top of a
mountain (20,500 ft). Find the change in elevation from the lowest elevation to the highest elevation.
Chapter 5 Solutions
MyLab Math with Pearson eText - Stand Alone Access Card - for Calculus for Business, Economics, Life Sciences & Social Sciences, Brief Version (14th Edition)
Mathematics with Applications In the Management, Natural, and Social Sciences (12th Edition)
Knowledge Booster
Learn more about
Need a deep-dive on the concept behind this application? Look no further. Learn more about this topic, subject and related others by exploring similar questions and additional content below.

 57. Use a graphing calculator to graph y = 1 – Ce−x for C = −2, −1, 1, and 2, for − 5 ≤ x ≤ 5, −5 ≤ y ≤ 5, all in the same viewing window. Observe how the solution curves go with the flow of the tangent line segments in the corresponding slope field shown in Figure A or Figure B.


 Algebra: Structure And Method, Book 1AlgebraISBN:9780395977224Author:Richard G. Brown, Mary P. Dolciani, Robert H. Sorgenfrey, William L. ColePublisher:McDougal Littell
 Algebra & Trigonometry with Analytic GeometryAlgebraISBN:9781133382119Author:SwokowskiPublisher:Cengage
 Glencoe Algebra 1, Student Edition, 9780079039897...AlgebraISBN:9780079039897Author:CarterPublisher:McGraw Hill
 Trigonometry (MindTap Course List)TrigonometryISBN:9781305652224Author:Charles P. McKeague, Mark D. TurnerPublisher:Cengage Learning
 Linear Algebra: A Modern IntroductionAlgebraISBN:9781285463247Author:David PoolePublisher:Cengage Learning