Concept explainers
Videos
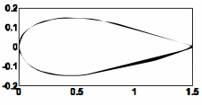
The shape of a symmetrical four-digit NACA airfoil is described by the equation.
Where c is the cord length and t is the maximum thickness as a fraction of the cord length (tc = maximum thickness). Symmetrical four-digit NACA airfoils are designated NACA 00XX, where XX is 100t(i.e., NACA 0012 has t = 0.12). Plot the shape of a NACA 0020 airfoil with a cord length of 1.5 m.
Want to see the full answer?
Check out a sample textbook solution
Chapter 5 Solutions
MATLAB: An Introduction with Applications


- A man throws a ball into the air with a velocity of 96 ft/sec. Use the formula h=16t2+v0t to determine when the height of the ball will be 48 feet. Round to the nearest tenth of a second.arrow_forwardThe position of a particle moving along a coordinate line is s= /28 + 4t, with s in meters and t in seconds. Find the particle's velocity and acceleration at t= 2 sec. The velocity at t= 2 sec is m/ sec. (Simplify your answer. Type an integer or a fraction.)arrow_forwardFind the paler form of Z= 1 +4iarrow_forward
- Find the real component if is evaluated at z = 3 + 4i when a=79 , b = 5, c = 8, d = 13 and n = 3 . Round off your final answer to five decimal places. Answer must be in decimalarrow_forwardA cup of water at an initial temperature of 81°C is placed in a room at a constant temperature of 24°C. The temperature of the water is measured every 5 minutes during a half-hour period. The results are recorded as ordered pairs of the form (t, T), where t is the time (in minutes) and T is the temperature (in degrees Celsius). (0, 81.0°), (5, 69.0°), (10, 60.5°), (15, 54.2°), (20, 49.3°), (25, 45.4°), (30, 42.6°) (a) Subtract the room temperature from each of the temperatures in the ordered pairs. Use a graphing utility to plot the data points (t, T) and (t, T − 24). (b) An exponential model for the data (t, T − 24) is T − 24 = 54.4(0.964)t. Solve for T and graph the model. Compare the result with the plot of the original data. (c) Use a graphing utility to plot the points (t, ln(T − 24)) and observe that the points appear to be linear. Use the regression feature of the graphing utility to fit a line to these data. This resulting line has the form ln(T − 24) = at + b, which is…arrow_forward
 Algebra & Trigonometry with Analytic GeometryAlgebraISBN:9781133382119Author:SwokowskiPublisher:Cengage
 Elementary AlgebraAlgebraISBN:9780998625713Author:Lynn Marecek, MaryAnne Anthony-SmithPublisher:OpenStax - Rice University
 Algebra: Structure And Method, Book 1AlgebraISBN:9780395977224Author:Richard G. Brown, Mary P. Dolciani, Robert H. Sorgenfrey, William L. ColePublisher:McDougal Littell
 Calculus For The Life SciencesCalculusISBN:9780321964038Author:GREENWELL, Raymond N., RITCHEY, Nathan P., Lial, Margaret L.Publisher:Pearson Addison Wesley,