
Financial And Managerial Accounting
15th Edition
ISBN: 9781337902663
Author: WARREN, Carl S.
Publisher: Cengage Learning,
expand_more
expand_more
format_list_bulleted
Videos
Textbook Question
Chapter 5, Problem 2MAD
Analyze Dollar General
Dollar General Corporation (DG) is a discount retailer with more than 12,000 stores. It offers a wide range of merchandise normally for $10 or less. The following data (in millions) were taken from recent financial statements of Dollar General:
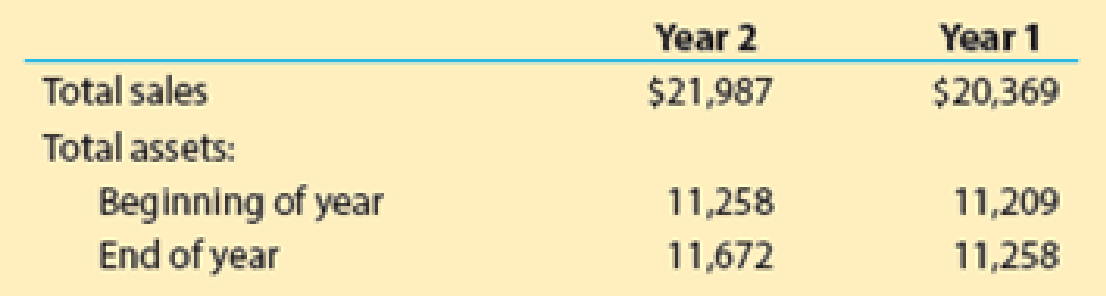
a. Compute the asset turnover ratio for Year 2 and Year 1. Round to two decimal places.
b. Interpret the change in the asset turnover ratio from Year 1 to Year 2.
Expert Solution & Answer

Trending nowThis is a popular solution!

Students have asked these similar questions
10. Review the select information for Bean Superstore and Legumes Plus (industry
competitors), and then complete the following.
A. Compute the accounts receivable turnover ratios for each company for 2018 and 2019.
B Compute the number of days sales in receivables ratios for each company for 2018 and
2019
C. Determine which company is the better investment and why. Round answers to two
decimal places.
Select financial information for Beta Corp. for the fiscal years ending December 20X4 and 20X5 is as follows:
please find the attached image 1 and 2
5. Beta Corp. has calculated the following asset management ratios:
Asset management 20X5 20X4A/R turnover 3.3 5.1Inventory turnover 1.4 1.2
Based on the above ratios, which of the following statements is true?
a) Beta was more efficient in collecting its credit sales from customers in 20X5 than in the prior year. It was also more efficient in turning inventory into sales than in the prior year.b) Beta was less efficient in collecting its credit sales from customers in 20X5 than in the prior year. It was also less efficient in turning inventory into sales than in the prior year.c) Beta was less efficient in collecting its credit sales from customers in 20X5 than in the prior year. However, it was more efficient in turning inventory into sales than in the prior year.d) Beta was more efficient in…
McDonald’s Corporation (MCD) reported the following balance sheet and income statement data for two recent years: (amounts are in $ millions)
Total assets Net Income SalesYear 1: $33,803.70 $5,192.30 $22,820.40Year 2: $32,811.20 $5,924.30 $21,025.20
What was McDonald’s asset turnover ratio for Year 2?
Chapter 5 Solutions
Financial And Managerial Accounting
Ch. 5 - Prob. 1DQCh. 5 - Can a business earn a gross profit but incur a net...Ch. 5 - The credit period during which the buyer of...Ch. 5 - What is the meaning of (A) 1/15, n/60; (B) n/30;...Ch. 5 - How are sales to customers using MasterCard and...Ch. 5 - What is the nature of (A) a credit memo issued by...Ch. 5 - Who is responsible for freight when the terms of...Ch. 5 - Name three accounts that would normally appear in...Ch. 5 - Audio Outfitter Inc., which uses a perpetual...Ch. 5 - Assume that Audio Outfitter Inc. in Discussion...
Ch. 5 - Gross profit During the current year, merchandise...Ch. 5 - Purchases transactions Elkhorn Company purchased...Ch. 5 - Prob. 3BECh. 5 - Freight terms Determine the amount to be paid in...Ch. 5 - Transactions for buyer and seller Shore Co. sold...Ch. 5 - Adjusting entries Hahn Flooring Company uses a...Ch. 5 - Asset turnover ratio Financial statement data for...Ch. 5 - Determining gross profit During the current year,...Ch. 5 - Determining cost of goods sold For a recent year,...Ch. 5 - Chart of accounts Monet Paints Co. is a newly...Ch. 5 - Purchase-related transactions The Stationery...Ch. 5 - Purchase-related transactions A retailer is...Ch. 5 - Purchase-related transactions The debits and...Ch. 5 - Prob. 7ECh. 5 - Purchase-related transactions Journalize entries...Ch. 5 - Sales-related transactions, including the use of...Ch. 5 - Customer refund Senger Company sold merchandise of...Ch. 5 - Prob. 11ECh. 5 - Prob. 12ECh. 5 - Sales-related transactions The debits and credits...Ch. 5 - Prob. 14ECh. 5 - Determining amounts to be paid on invoices...Ch. 5 - Sales-related transactions Showcase Co., a...Ch. 5 - Purchase-related transactions Based on the data...Ch. 5 - Prob. 18ECh. 5 - Prob. 19ECh. 5 - Normal balances of accounts for retail business...Ch. 5 - Income statement and accounts for retail business...Ch. 5 - Adjusting entry for inventory shrinkage Omega Tire...Ch. 5 - Adjusting entry for customer refunds, allowances,...Ch. 5 - Adjusting entry for customer refunds, allowances,...Ch. 5 - Income statement for retail business The following...Ch. 5 - Determining amounts for items omitted from income...Ch. 5 - Multiple-step income statement On March 31, 20Y9,...Ch. 5 - Multiple-step income statement The following...Ch. 5 - Single-step income statement Summary operating...Ch. 5 - Closing the accounts of a retail business From the...Ch. 5 - Closing entries; net income Based on the data...Ch. 5 - Closing entries On July 31, the close of the...Ch. 5 - Prob. 33ECh. 5 - Prob. 34ECh. 5 - Appendix 1 Adjusting entry for gross method The...Ch. 5 - Appendix 1 Discount taken in next fiscal year...Ch. 5 - Prob. 37ECh. 5 - Rules of debit and credit for periodic inventory...Ch. 5 - Journal entries using the periodic inventory...Ch. 5 - Identify items missing in determining cost of...Ch. 5 - Cost of goods sold and related items The following...Ch. 5 - Cost of goods sold Based on the following data,...Ch. 5 - Cost of goods sold Based on the following data,...Ch. 5 - Appendix 2 Cost of goods sold Identify the errors...Ch. 5 - Closing entries using periodic inventory system...Ch. 5 - Purchase-related transactions using perpetual...Ch. 5 - Sales-related transactions using perpetual...Ch. 5 - Sales and purchase-related transactions using...Ch. 5 - A Sales and purchase-related transactions for...Ch. 5 - Multiple-step income statement and balance sheet...Ch. 5 - Single-step income statement and balance sheet...Ch. 5 - Appendix 2 Purchase-related transactions using...Ch. 5 - Sales and purchase-related transactions using...Ch. 5 - Appendix 2 PR 5-9A Sales and purchase-related...Ch. 5 - 2. Net income, 185,000 Appendix 2 PR 5-10A...Ch. 5 - Purchase-related transactions using perpetual...Ch. 5 - Sales-related transactions using perpetual...Ch. 5 - Sales and purchase-related transactions using...Ch. 5 - Sales and purchase-related transactions for seller...Ch. 5 - Multiple-step income statement and balance sheet...Ch. 5 - Single-step income Statement and balance sheet...Ch. 5 - Purchase-related transactions using periodic...Ch. 5 - Sales and purchase-related transactions using...Ch. 5 - Appendix 2 Sales and purchase-related transactions...Ch. 5 - Appendix 2 PR 5-10B Periodic inventory accounts,...Ch. 5 - Palisade Creek Co. is a retail business that uses...Ch. 5 - Analyze and compare Amazon.com and Netflix...Ch. 5 - Analyze Dollar General Dollar General Corporation...Ch. 5 - Compare Dollar Tree and Dollar General The asset...Ch. 5 - Analyze and compare CSX, Union Pacific, and YRC...Ch. 5 - Analyze Home Depot The Home Depot (HD) reported...Ch. 5 - Analyze and compare Kroger and Tiffany The Kroger...Ch. 5 - Prob. 7MADCh. 5 - Ethics in Action Margie Johnson is a staff...Ch. 5 - Prob. 2TIFCh. 5 - Prob. 5TIFCh. 5 - Prob. 6TIFCh. 5 - Prob. 7TIF
Knowledge Booster


Learn more about
Need a deep-dive on the concept behind this application? Look no further. Learn more about this topic, accounting and related others by exploring similar questions and additional content below.Similar questions
- Analyze and compare Kroger and Tiffany The Kroger Company (KR), a national supermarket chain, reported the following data (in millions) in its financial statements for a recent year: a.Compute the asset turnover ratio. Round to two decimal places. b.Tiffany Co. (TIF) is a large North American retailer of jewelry. Tiffanys asset turnover ratio is 0.78. Why would Tiffanys asset turnover ratio be lower than that of Kroger?arrow_forwardJuroe Company provided the following income statement for last year: Juroes balance sheet as of December 31 last year showed total liabilities of 10,250,000, total equity of 6,150,000, and total assets of 16,400,000. Required: 1. Calculate the return on sales. (Note: Round the percent to two decimal places.) 2. CONCEPTUAL CONNECTION Briefly explain the meaning of the return on sales ratio, and comment on whether Juroes return on sales ratio appears appropriate.arrow_forwardLast year, Tobys Hats had net sales of 45,000,000 and cost of goods sold of 29,000,000. Tobys had the following balances: Refer to the information for Tobys on the previous page. Required: Note: Round answers to one decimal place. 1. Calculate the average accounts receivable. 2. Calculate the accounts receivable turnover ratio. 3. Calculate the accounts receivable turnover in days.arrow_forward
- Kroger Co., a national supermarket chain, reported the following data (in millions) in its financial statements for a recent year: Total revenue $108,465 Total assets at end of year 30,556 Total assets at beginning of year 29,281 a. Compute the asset turnover. Round to two decimal places. b. Tiffany & Co. is a large North American retailer of jewelry with an asset turnover of 0.86. Why would Tiffany's asset turnover be lower than that of Kroger?arrow_forwardRevenue and expense data for Young Technologies Inc. are as follows: Year 2 Year 1 Sales $500,000 $440,000 Cost of goods sold 325,000 242,000 Selling expenses 70,000 79,200 Administrative expenses 75,000 70,400 Income tax expense 10,500 16,400 Required: (a) Prepare an income statement in comparative form, stating each item for both years as an amount and as a percent of sales. Round your percentages answers to one decimal place. Enter all amounts as positive numbers. (b) Comment on the significant changes disclosed by the comparative income statement. Prepare an income statement in comparative form, stating each item for both years as an amount and as a percent of sales. Round your percentages answers to one decimal place. Enter all amounts as positive numbers. Young Technologies Inc. Comparative Income Statement For the Years Ended December 31, Year 2 and Year 1 1 Year 2 Year 2 Year 1 Year 1…arrow_forward10. Review the select information for Bean Superstore and Legumes Plus (industry competitors), and then complete the following. A. Compute the accounts receivable turnover ratios for each company for 2018 and 2019. B. Compute the number of days' sales in receivables ratios for each company for 2018 and 2019. C. Determine which company is the better investment and why. Round answers to two decimal places. BEAN SUPERSTORE LEGUMES PLUS Comparative Balance Sheet December 31, 2017, 2018, and 2019 Comparative Balance Sheet December 31, 2017, 2018, and 2019 2019 2018 2017 2019 2018 2017 Assets Cash $345,600 67,000 145,830 100,465 $330,460 62,000 178,011 101,202 $300,000 59,000 155,205 103,085 $407,000 85,430 128,080 182,006 $386,450 82,670 40,036 23,400 $356,367 79,230 52,142 111,701 Accounts Receivable Inventory Equipment Total Assets $658,895 $671,673 $617,290 $802,516 $532,556 $599,440 Liabilities Salaries Payable Accounts Payable Notes Payable $ 91,455 $ 90,200 70,000 41,000 $ 88,563…arrow_forward
- The balance sheet for Revolution Clothiers is shown below. Sales for the year were $3,190,000, with 75 percent of sales sold on credit. REVOLUTION CLOTHIERS Balance Sheet 20X1 Assets Cash Accounts receivable Inventory Plant and equipment Total assets $ 24,000 283,000 266,000 450,000 a. Current ratio b. Quick ratio c. Debt-to-total-assets ratio d. Asset turnover e. Average collection period $ 1,023,000 Accounts payable Accrued taxes Liabilities and Equity times times % times days Bonds payable (long-term) Common stock Paid-in capital Retained earnings Total liabilities and equity Compute the following ratios: Note: Use a 360-day year. Do not round intermediate calculations. Round your answers to 2 decimal places. Input your debt-to- total assets answer as a percent rounded to 2 decimal places. $ 279,000 107,000 130,000 100,000 150,000 257,000 $ 1,023,000arrow_forwardCalculate the following financial ratios for Phone Corporation: (Use 365 daysin a year. Do not round intermediate calculations. Round your finalanswers to 2 decimal places.)1. Return on Assets (use average balance sheet figures)2. Return on capital (use average balance sheet figures) %3. Days in inventory (use start of year balance sheet figures) %4. Inventory turnover (use start of year balance sheet figures5. Average collection period (use start of year balance sheet figures)6. Operating profit margin %7. Long term debt ratio (use end of year balance sheet figures)8. Total Debt ratio (use end of year balance sheet figures)arrow_forwardThe following financial data (in thousands) were taken from recent financial statements of Staples, Inc.: Please see the attachment for details: 1. Determine the times interest earned ratio for Staples in Year 3, Year 2, and Year 1? Round your answers to one decimal place.2. Evaluate this ratio for Staples.arrow_forward
- Complete the balance sheet and sales information using the following financial data: Total assets turnover: 1x Days sales outstanding: 36.5 days Inventory turnover ratio: 3.75x Fixed assets turnover: 3.0x Current ratio: 2.5x Gross profit margin on sales: (Sales - Cost of goods sold)/Sales = 35% *Calculation is based on a 365-day year. Do not round intermediate calculations. Round your answers to the nearest dollar. Balance Sheet Cash Accounts receivable Inventories Fixed assets Total assets Sales MA $240,000 Current liabilities. Long-term debt Common stock Retained earnings Total liabilities and equity Cost of goods sold $ 60,000 84,000arrow_forwardSolve for (A) current ratio, (B) acid test, (C) average day's collection (360), (D) asset turnover, and (E) profit margin on sales. (Round to nearest hundredth or hundredth percent as needed.) Current Assets Accounts Receivable Current Liabilities Inventory Net Sales Total Assets Net Income $ 26,000 $ 4,100 $ 16,500 $4,100 $ 52,000 $ 38,000 $ 8,000arrow_forwardCOMPANY B Balance Sheets December 31, Year 2 and Year 1 Year 2 Year 1 Assets Current assets: Cash Accounts receivable Inventory Investments Long-term assets: Land $ 217,600 58,000 85,000 3,000 $ 110,000 82,000 70,000 1,000 380,000 690,000 (328,000) $1,105,600 380,000 570,000 (168,000) $1,045,000 Equipment Less: Accumulated depreciation Total assets Liabilities and Stockholders' Equity Current liabilities: Accounts payable Interest payable Income tax payable Long-term liabilities: Notes payable Stockholders' equity: Common stock Retained earnings $ 89,000 $4 5,000 7,000 75,000 11,000 4,000 120,000 240,000 600,000 284,600 $1,105,600 $1,045,000 600,000 115,000 Total liabilities and stockholders' equity Additional information for Year 2: 1. Net income is $169,600. 2. Sales on account are $1,183,000. 3. Cost of goods sold is $953,250. Required: 1. Calculate the following profitability ratios for Year 2: (Round vour answers to 1 decimal place.)arrow_forward
arrow_back_ios
SEE MORE QUESTIONS
arrow_forward_ios
Recommended textbooks for you
- Financial And Managerial AccountingAccountingISBN:9781337902663Author:WARREN, Carl S.Publisher:Cengage Learning,
 Managerial Accounting: The Cornerstone of Busines...AccountingISBN:9781337115773Author:Maryanne M. Mowen, Don R. Hansen, Dan L. HeitgerPublisher:Cengage Learning
Financial And Managerial Accounting
Accounting
ISBN:9781337902663
Author:WARREN, Carl S.
Publisher:Cengage Learning,
Managerial Accounting: The Cornerstone of Busines...
Accounting
ISBN:9781337115773
Author:Maryanne M. Mowen, Don R. Hansen, Dan L. Heitger
Publisher:Cengage Learning
Financial ratio analysis; Author: The Finance Storyteller;https://www.youtube.com/watch?v=MTq7HuvoGck;License: Standard Youtube License