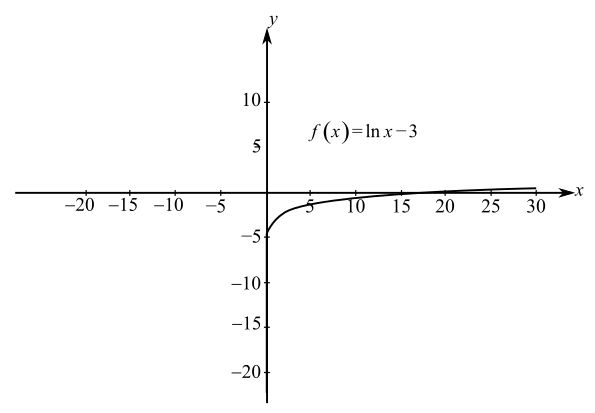
Sketching a Graph In Exercises 1 and 2, sketch the graph of the function and state its domain.
To graph: The function
Explanation of Solution
Given:
The function to be plotted is
Graph:
Use Ti-83 to plot the graph of the function:
Step 1: Press the
Step 2: Enter the equations in
Step 3: Press
Step 4: Press the

Interpretation:
The domain of the function
Want to see more full solutions like this?
Chapter 5 Solutions
Calculus
- check the image for questionarrow_forwardUse a graphing utility to graph f(x) = x3 − 3x2 . Use the graph to write a formula for the function g shown in the figurearrow_forwardU.S. AIDS Deaths The function D defined by D(x) = 2375x² + 5134x + 5020 models AIDS deaths x years after 1984. Write a for- mula g(x) that computes AIDS deaths during year x, where x is the actual year.arrow_forward
- Ventilation Rate In Exercise 21 and 22, use the model y=80.411lnx,100x1500 which approximates the minimum required ventilation rate in terms of the air space per child in a public school classroom. In the model, x is the air space (in cubic feet) per child and y is the ventilation rate (in cubic feet per minute) per child. Use a graphing utility to graph the model and approximate the required ventilation rate when there are 300 cubic feet of air space per child.arrow_forwardThe number of people afflicted with the common cold in the winter months dropped steadily by 50 each yearsince 2004 until 2010. In 2004, 875 people were inflicted. Find the linear function that models the number of people afflicted with the common cold C as a function of theyear, t. When will no one be afflicted?arrow_forwardThink About It In Exercises 33 and 34, use the graph to determine whether y varies directly as some power of x or inversely as some power of x. Explain.arrow_forward
- HOW DO YOU SEE IT? The figure shows the graphs of y=lnx,y=lnx2,y=ln2x, and y=ln2. Match each function with its graph. (The graphs are labeled A through D .) Explain.arrow_forwardPipe is to be laid from point A in a rectangular plot of size 10 x 20 feet to a point P on side BC and from there on to C as shown in red in the figure below. The cost of laying pipe within the plot is $c per foot (it must be underground), while the cost of laying pipe along the side of the plot is $d per foot. 10 A 20 (a) Determine the total cost, f(x), as a function of c, d and x, where x is the distance from P to B. (Note that f(x) is discontinuous at x = 0.) f(x) = dollars (b) What is the cost of laying the pipe on the side of the plot (x = 0) when c = 30 and d = 25? (Round your answer to the nearest cent.) (c) What is the least cost of laying the pipe when c = 30 and d = 25? (Round your answer to the nearest cent.)arrow_forwardSketch the graph of f.arrow_forward
- The graph of the function f(x)=1x−3+14 is a transformation of the graph of the function g(x)=1x by A vertical shift (up, down,left or right) of ? units A horizonal shift (up, down,left or right) of ? unitsarrow_forwardDefind constant-valued functions ?arrow_forwardWrite a formula for the function g(x) obtained when the graph of f(x) = Vx is shifted up 1 unit and to the left 2 units. g(x) = Additional Materials I eBook Function Transformationsarrow_forward
- Algebra & Trigonometry with Analytic GeometryAlgebraISBN:9781133382119Author:SwokowskiPublisher:Cengage

 Trigonometry (MindTap Course List)TrigonometryISBN:9781337278461Author:Ron LarsonPublisher:Cengage Learning
  College AlgebraAlgebraISBN:9781305115545Author:James Stewart, Lothar Redlin, Saleem WatsonPublisher:Cengage Learning


