
(a)
To show:
The effect on the market for wheat in the given case with the help of the
Answer to Problem 1P
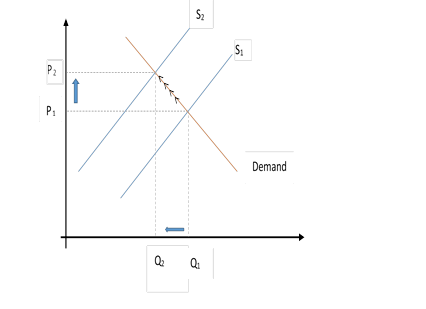
The market for wheat will see a decrease in supply. This is due to the unfavorable weather condition which will result into a higher
Explanation of Solution
The unfavorable weather condition brings a situation where there is a limitation in the supply of the wheat crop leading to an increase in price of the crop. As in
If there is a decrease in supply of wheat, then the price will go up, which will result to lowering demand that will lead to new equilibrium,
When the supply of crop of wheat falls from S1to S2due to floods, then there will be a rise in price from P1to P2.
Demand and supply curve:
Demand and supply curve represents the relationship between the quantities of the product a supplier supplies in the market and the quantity of the product a consumer demands. The point where the supply and demand curve meets are referred to as the equilibrium price.
(b)
To show:
The effect on the market for wheat in the given case with the help of the supply and demand curve.
Answer to Problem 1P
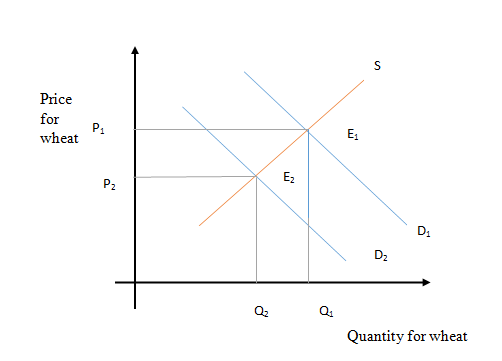
Corn is a substitute for wheat, and there is a decrease in price for corn.There will be reduction in demand for wheat resulting in a decrease of price and quantity of wheat.
When a substitute is available in the market for a product in lower price then there will be chances of drop in the demand of that product. As corn is a substitute of wheat, fall in the price of corn will lead to a decrease in demand for wheat, resulting in leftward shift of demand curve. The prices and quantity of wheat will go down causing new equilibrium, E2.
In this case, it could be seen that with decrease of demand of wheat from D1to D2, there will be a shift in price of wheat too from P1 to P2.
(c)
To show:
The effect on the market for wheat in the given case with the help of the supply and demand curve.
Demand and supply curve:
Demand and supply curve represents the relationship between the quantities of product a supplier supplies in the market and quantity of product a consumer demand. The point where the supply and demand curves meet is referred to as the equilibrium price. This is the price at which a supplier agrees to supply the commodities and the consumers agree to buy.
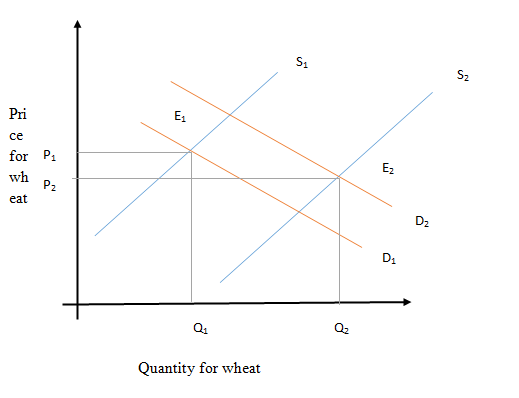
If it is a favorable weather condition for wheat, it would result to the increase in the production of wheat, leading into the increase in the supply of wheat.
In the given case, initial equilibrium is represented with
With the increase of supply in wheat, there will be lower equilibrium of price represented by
(d)
To show:
The effect on the market for wheat in the given case with the help of the supply and demand curve.
Demand and supply curve:
Demand and supply curve represents the relationship between the quantities of product a supplier supplies in the market and quantity of product a consumer demands. The point where the supply and demand curves meet is referred to as the equilibrium price. This is the price at which a supplier agrees to supply the commodities and the consumers agree to buy.
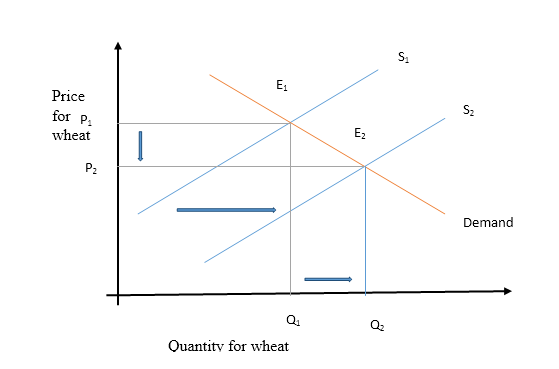
With the falling price of fertilizers, there will be an increase in the supply of wheat. This will result into dipping of the price of wheat and increase in the equilibrium quantity traded.
Fertilizer is one of the core component in agriculture. Any change in price of the fertilizers would affect the demand and supply condition of crop too. With the fall in price of fertilizers, the cost of producing wheat will go down that will lead to increase in supply. As a result of increase in supply, price of wheat will go down, but the movement of supply curve will outweigh the movement of price leading into equilibrium price of wheat to fall (from P1 to P2).
In the graph, there is a rise in supply from S1to S2, which will lead to a fall in the price from P1to P2.
(e)
To show:
The effect on the market for wheat in the given case with the help of the supply and demand curve.
Demand and supply curve:
Demand and supply curve represents the relationship between the quantities of product a supplier supplies in the market and quantity of product a consumer demand. The point where the supply and demand curves meet is referred to as the equilibrium price. This is the price at which a supplier agrees to supply the commodities and the consumers agree to buy.
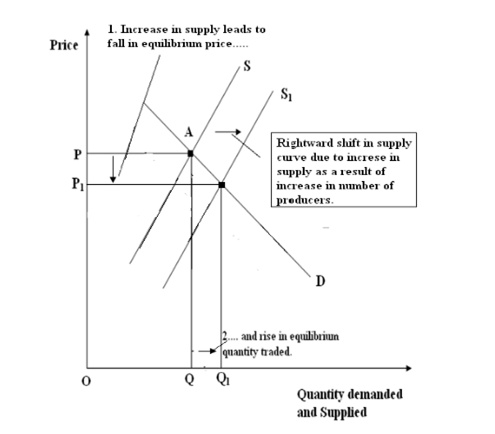
With the involvement of more individual in growing wheat there will be increase in supply of wheat. This will result into price of wheat dipping.
The initial equilibrium is at point A.With increase in wheat growers the supply of the wheat will also increase. The initial supply curve will shift rightwards from S to S1,the change in supply will form new equilibrium at point B, by intersection of new supply curve S1and demand curve D.
Due to the increase in supply of wheat, the price will decrease from P to P1with increase in equilibrium quantity traded at Q1.
Explanation of Solution
When a substitute is available in the market for a product in lower price then there will be chances of drop in the demand of that product. As corn is a substitute of wheat, fall in the price of corn will lead to a decrease in demand for wheat, resulting in leftward shift of demand curve. The prices and quantity of wheat will go down causing new equilibrium, E2.
In this case, it could be seen that with decrease of demand of wheat from D1to D2, there will be a shift in price of wheat too from P1 to P2.
Demand and supply curve:
Demand and supply curve represents the relationship between the quantities of product a supplier supplies in the market and the quantity of product a consumer demands. The point where the supply and demand curves meet is referred to as the equilibrium price. This is the price at which a supplier agrees to supply the commodities and the consumers agree to buy.
(c)
To show:
The effect on the market for wheat in the given case with the help of the supply and demand curve.
Answer to Problem 1P
If it is a favorable weather condition for wheat, it would result to the increase in the production of wheat, leading into the increase in the supply of wheat.
Explanation of Solution
In the given case, initial equilibrium is represented with
With the increase of supply in wheat, there will be lower equilibrium of price represented by
Demand and supply curve:
Demand and supply curve represents the relationship between the quantities of product a supplier supplies in the market and quantity of product a consumer demand. The point where the supply and demand curves meet is referred to as the equilibrium price. This is the price at which a supplier agrees to supply the commodities and the consumers agree to buy.
(d)
To show:
The effect on the market for wheat in the given case with the help of the supply and demand curve.
Answer to Problem 1P
With the falling price of fertilizers, there will be an increase in the supply of wheat. This will result into dipping of the price of wheat and increase in the equilibrium quantity traded.
Explanation of Solution
Fertilizer is one of the core component in agriculture. Any change in price of the fertilizers would affect the demand and supply condition of crop too. With the fall in price of fertilizers, the cost of producing wheat will go down that will lead to increase in supply. As a result of increase in supply, price of wheat will go down, but the movement of supply curve will outweigh the movement of price leading into equilibrium price of wheat to fall (from P1 to P2).
In the graph, there is a rise in supply from S1to S2, which will lead to a fall in the price from P1to P2.
Demand and supply curve:
Demand and supply curve represents the relationship between the quantities of product a supplier supplies in the market and quantity of product a consumer demands. The point where the supply and demand curves meet is referred to as the equilibrium price. This is the price at which a supplier agrees to supply the commodities and the consumers agree to buy.
(e)
To show:
The effect on the market for wheat in the given case with the help of the supply and demand curve.
Answer to Problem 1P
With the involvement of more individual in growing wheat there will be increase in supply of wheat. This will result into price of wheat dipping.
Explanation of Solution
The initial equilibrium is at point A.With increase in wheat growers the supply of the wheat will also increase. The initial supply curve will shift rightwards from S to S1,the change in supply will form new equilibrium at point B, by intersection of new supply curve S1and demand curve D.
Due to the increase in supply of wheat, the price will decrease from P to P1with increase in equilibrium quantity traded at Q1.
Demand and supply curve:
Demand and supply curve represents the relationship between the quantities of product a supplier supplies in the market and quantity of product a consumer demand. The point where the supply and demand curves meet is referred to as the equilibrium price. This is the price at which a supplier agrees to supply the commodities and the consumers agree to buy.
Want to see more full solutions like this?
Chapter 5 Solutions
Exploring Microeconomics

- There was a disruption in production and shipment of fertilizer when Russia invaded Ukraine in March 2022. How does the event in the market for fertilizer transition into the market for food. Explain and draw the graphs for both the markets.arrow_forwardif nothing else is changing. what will happen when the price for using golf courses falls ? A. more people purchase golfing equipment B. the supply of golf courses increases C. the demand rises for other summer activities D. the amount of people golfing fallsarrow_forwardMany changes are affecting the market for oil. Predict how each of the following events will affect the equilibrium price and quantity in the market for oil. In each case, state how the event will affect the supply and demand diagram. Create a sketch of the diagram if necessary. a. Cars are becoming more fuel efficient, and therefore get more miles to the gallon. b. The winter is exceptionally cold. c. A major discovery of new oil is made off the coast of Norway. d. The economies of some major oil-using nations, like Japan, slow down. e. A war in the Middle East disrupts oil-pumping schedules. f. Landlords install additional insulation in buildings. g. The price of solar energy falls dramatically. h. Chemical companies invent a new, popular kind of plastic made from oil.arrow_forward
- Complete the paragraph by filling in the blanks based on what you have learned from the lesson. Choose your answer from the words below. INCREASES PRICE SCHEDULE TECHNOLOGY LESSER PREFERENCES SUBSTITUTE PRODUCT CURVE WEATHER GOVERNMENT POLICY SEASONAL PRODUCTS SURPLUS SHORTAGE I learned additional lessons in Applied Economics. This week I learned about the law of supply which states that when the increases the quantity of products that the producer is willing to sell. and the law of demand which states that the higher the the the demand. To be able to analyze the demand and supply I can use the demand and supply and the demand and supply graphical representation of the relationship of price and quantity. I also understand that aside from price, there are other factors that may affect the supply some of these are and There are also factors that may affect demand like and I can say that it is better if there is market equilibrium which means that the quantity supplied and the quantity…arrow_forwardGraph the demand for wheat and the supply of wheat. Be sure to label the axes of your graph correctly. Label equilibrium price P and equilibrium Quantityarrow_forwardWhich of the following would cause a supply curve to shift to the left? A. The cost of resources needed to produce a good increases. B. The government lowers taxes on the import of a good. C. The technology used to produce a good improves. D. The number of sellers of a particular good increases.arrow_forward
- Graph the demand of wheat and the supply of wheat. Be sure to locate the equilibrium price and quantity.arrow_forwardSuppose that many vineyards in California were burned by wildfires during and shortly after the release of the movie Sideways. If both the quantity sold and price of Pinot Noir increased in the market after the movie release, what does this imply? Select one: a. The decrease in supply was greater than the increase in demand. b. The increase in demand was greater than the decrease in supply. C. The increase in supply was greater than the decrease in demand. d. The decrease in demand was greater than the increase in supply.arrow_forward
 Macroeconomics: Private and Public Choice (MindTa...EconomicsISBN:9781305506756Author:James D. Gwartney, Richard L. Stroup, Russell S. Sobel, David A. MacphersonPublisher:Cengage Learning
 Microeconomics: Private and Public Choice (MindTa...EconomicsISBN:9781305506893Author:James D. Gwartney, Richard L. Stroup, Russell S. Sobel, David A. MacphersonPublisher:Cengage Learning
 Economics: Private and Public Choice (MindTap Cou...EconomicsISBN:9781305506725Author:James D. Gwartney, Richard L. Stroup, Russell S. Sobel, David A. MacphersonPublisher:Cengage Learning
 Exploring EconomicsEconomicsISBN:9781544336329Author:Robert L. SextonPublisher:SAGE Publications, Inc
 Economics (MindTap Course List)EconomicsISBN:9781337617383Author:Roger A. ArnoldPublisher:Cengage Learning