
(a)
To show:
The effect on the market for wheat in the given case with the help of the
Answer to Problem 1P
The market for wheat will see a decrease in supply. This is due to the unfavorable weather condition which will result into a higher
Explanation of Solution
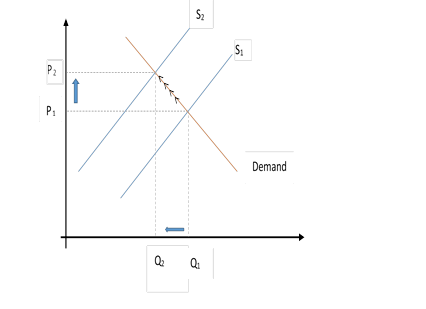
The unfavorable weather condition brings a situation where there is a limitation in the supply of the wheat crop leading to an increase in price of the crop. As in demand supply concept, when there is rise in price there will be an inverse relation with supply; so, there will be a fall in supply.
If there is a decrease in supply of wheat, then the price will go up, which will result to lowering demand that will lead to new equilibrium,
When the supply of crop of wheat falls from S1to S2due to floods, then there will be a rise in price from P1to P2.
Demand and supply curve:
Demand and supply curve represents the relationship between the quantities of the product a supplier supplies in the market and the quantity of the product a consumer demands. The point where the supply and demand curve meets are referred to as the equilibrium price.
(b)
To show:
The effect on the market for wheat in the given case with the help of the supply and demand curve.
Answer to Problem 1P
Corn is a substitute for wheat, and there is a decrease in price for corn.There will be reduction in demand for wheat resulting in a decrease of price and quantity of wheat.
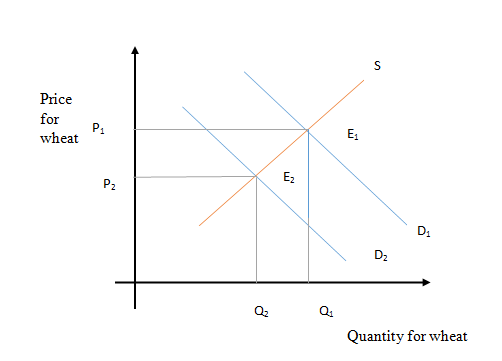
When a substitute is available in the market for a product in lower price then there will be chances of drop in the demand of that product. As corn is a substitute of wheat, fall in the price of corn will lead to a decrease in demand for wheat, resulting in leftward shift of demand curve. The prices and quantity of wheat will go down causing new equilibrium, E2.
In this case, it could be seen that with decrease of demand of wheat from D1to D2, there will be a shift in price of wheat too from P1 to P2.
(c)
To show:
The effect on the market for wheat in the given case with the help of the supply and demand curve.
Demand and supply curve:
Demand and supply curve represents the relationship between the quantities of product a supplier supplies in the market and quantity of product a consumer demand. The point where the supply and demand curves meet is referred to as the equilibrium price. This is the price at which a supplier agrees to supply the commodities and the consumers agree to buy.
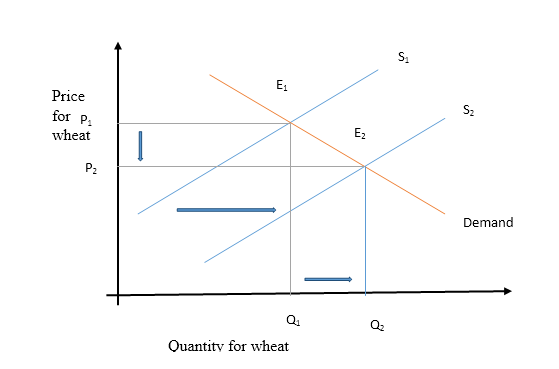
If it is a favorable weather condition for wheat, it would result to the increase in the production of wheat, leading into the increase in the supply of wheat.
In the given case, initial equilibrium is represented with
With the increase of supply in wheat, there will be lower equilibrium of price represented by
(d)
To show:
The effect on the market for wheat in the given case with the help of the supply and demand curve.
Demand and supply curve:
Demand and supply curve represents the relationship between the quantities of product a supplier supplies in the market and quantity of product a consumer demands. The point where the supply and demand curves meet is referred to as the equilibrium price. This is the price at which a supplier agrees to supply the commodities and the consumers agree to buy.
With the falling price of fertilizers, there will be an increase in the supply of wheat. This will result into dipping of the price of wheat and increase in the equilibrium quantity traded.
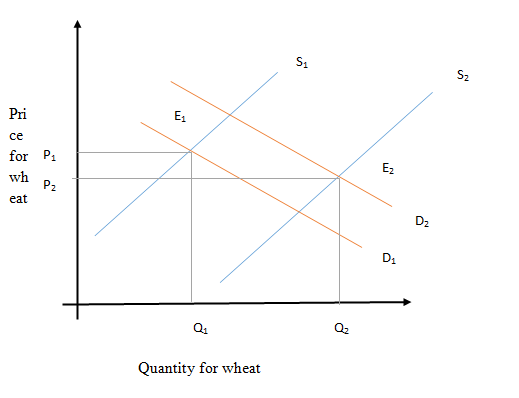
Fertilizer is one of the core component in agriculture. Any change in price of the fertilizers would affect the demand and supply condition of crop too. With the fall in price of fertilizers, the cost of producing wheat will go down that will lead to increase in supply. As a result of increase in supply, price of wheat will go down, but the movement of supply curve will outweigh the movement of price leading into equilibrium price of wheat to fall (from P1 to P2).
In the graph, there is a rise in supply from S1to S2, which will lead to a fall in the price from P1to P2.
(e)
To show:
The effect on the market for wheat in the given case with the help of the supply and demand curve.
Demand and supply curve:
Demand and supply curve represents the relationship between the quantities of product a supplier supplies in the market and quantity of product a consumer demand. The point where the supply and demand curves meet is referred to as the equilibrium price. This is the price at which a supplier agrees to supply the commodities and the consumers agree to buy.
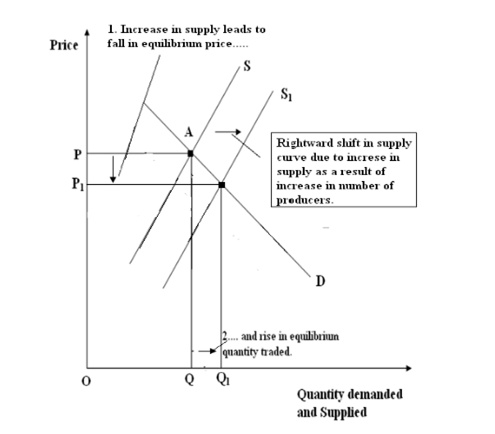
With the involvement of more individual in growing wheat there will be increase in supply of wheat. This will result into price of wheat dipping.
The initial equilibrium is at point A.With increase in wheat growers the supply of the wheat will also increase. The initial supply curve will shift rightwards from S to S1,the change in supply will form new equilibrium at point B, by intersection of new supply curve S1and demand curve D.
Due to the increase in supply of wheat, the price will decrease from P to P1with increase in equilibrium quantity traded at Q1.
Explanation of Solution
When a substitute is available in the market for a product in lower price then there will be chances of drop in the demand of that product. As corn is a substitute of wheat, fall in the price of corn will lead to a decrease in demand for wheat, resulting in leftward shift of demand curve. The prices and quantity of wheat will go down causing new equilibrium, E2.
In this case, it could be seen that with decrease of demand of wheat from D1to D2, there will be a shift in price of wheat too from P1 to P2.

Demand and supply curve:
Demand and supply curve represents the relationship between the quantities of product a supplier supplies in the market and the quantity of product a consumer demands. The point where the supply and demand curves meet is referred to as the equilibrium price. This is the price at which a supplier agrees to supply the commodities and the consumers agree to buy.
(c)
To show:
The effect on the market for wheat in the given case with the help of the supply and demand curve.
Answer to Problem 1P
If it is a favorable weather condition for wheat, it would result to the increase in the production of wheat, leading into the increase in the supply of wheat.
Explanation of Solution
In the given case, initial equilibrium is represented with
With the increase of supply in wheat, there will be lower equilibrium of price represented by

Demand and supply curve:
Demand and supply curve represents the relationship between the quantities of product a supplier supplies in the market and quantity of product a consumer demand. The point where the supply and demand curves meet is referred to as the equilibrium price. This is the price at which a supplier agrees to supply the commodities and the consumers agree to buy.
(d)
To show:
The effect on the market for wheat in the given case with the help of the supply and demand curve.
Answer to Problem 1P
With the falling price of fertilizers, there will be an increase in the supply of wheat. This will result into dipping of the price of wheat and increase in the equilibrium quantity traded.
Explanation of Solution
Fertilizer is one of the core component in agriculture. Any change in price of the fertilizers would affect the demand and supply condition of crop too. With the fall in price of fertilizers, the cost of producing wheat will go down that will lead to increase in supply. As a result of increase in supply, price of wheat will go down, but the movement of supply curve will outweigh the movement of price leading into equilibrium price of wheat to fall (from P1 to P2).
In the graph, there is a rise in supply from S1to S2, which will lead to a fall in the price from P1to P2.

Demand and supply curve:
Demand and supply curve represents the relationship between the quantities of product a supplier supplies in the market and quantity of product a consumer demands. The point where the supply and demand curves meet is referred to as the equilibrium price. This is the price at which a supplier agrees to supply the commodities and the consumers agree to buy.
(e)
To show:
The effect on the market for wheat in the given case with the help of the supply and demand curve.
Answer to Problem 1P
With the involvement of more individual in growing wheat there will be increase in supply of wheat. This will result into price of wheat dipping.
Explanation of Solution
The initial equilibrium is at point A.With increase in wheat growers the supply of the wheat will also increase. The initial supply curve will shift rightwards from S to S1,the change in supply will form new equilibrium at point B, by intersection of new supply curve S1and demand curve D.
Due to the increase in supply of wheat, the price will decrease from P to P1with increase in equilibrium quantity traded at Q1.

Demand and supply curve:
Demand and supply curve represents the relationship between the quantities of product a supplier supplies in the market and quantity of product a consumer demand. The point where the supply and demand curves meet is referred to as the equilibrium price. This is the price at which a supplier agrees to supply the commodities and the consumers agree to buy.
Want to see more full solutions like this?
Chapter 5 Solutions
Exploring Macroeconomics
- If there were 10 firms in this market, the short-run equilibrium price of ruthenium would be $ Therefore, in the long run, firms would would Because you know that competitive firms earn S per pound. At that price, firms in this industry the ruthenium market. economic profit in the long run, you know the long-run equilibrium price must be per pound. From the graph, you can see that this means there will be firms operating in the ruthenium industry in long-run equilibrium. True or False: Assuming implicit costs are positive, each of the firms operating in this industry in the long run earns positive accounting profit. O True O Falsearrow_forwardThe U.S. Census Bureau conducts annual surveys to obtain information on the percentage of the voting-age population that is registered to vote. Suppose that 679 employed persons and 690 unemployed persons are independently and randomly selected, and that 429 of the employed persons and 369 of the unemployed persons have registered to vote. Can we conclude that the percentage of employed workers (P1), who have registered to vote, exceeds the percentage of unemployed workers (P2), who have registered to vote? Use a significance level of α = 0.05 for the test. Step 4 of 6: Compute the value of the test statistic. Round your answer to two decimal places.arrow_forwardI need help with #12 pleasearrow_forward
- The U.S. Census Bureau conducts annual surveys to obtain information on the percentage of the voting-age population that is registered to vote. Suppose that 679 employed persons and 690 unemployed persons are independently and randomly selected, and that 429 of the employed persons and 369 of the unemployed persons have registered to vote. Can we conclude that the percentage of employed workers (P1), who have registered to vote, exceeds the percentage of unemployed workers (P2), who have registered to vote? Use a significance level of α = 0.05 for the test. Step 3 of 6: Compute the weighted estimate of p, p. Round your answer to three decimal places.arrow_forwardOn Saturday nights, the population share of viewers watching various broadcast TV networks are known to be: ABC 29% CBS 28% NBC 25% Other 18% A sample of 300 viewers on Sunday night showed the following numbers watching each network: ABC 95 CBS 70 NBC 89 Other 46 46arrow_forwardIf people's inflation expectations rise, the short-run Phillips curve will: a) Shift left b) Shift right c) experience a downwards movement along the existing curve d) experience a upwards movement along the existing curvearrow_forward
- According to the equation in the textbook, if the natural rate of unemployment is 5%,actual inflation is 4%, expected inflation is 2%, and α = 1, what would be theunemployment rate?Unemployment rate = Natural rate of unemployment – α(Actual inflation – Expectedinflation)arrow_forwardAn adverse aggregate demand shock will cause a ______ Phillips curve, and an adverse aggregate supply shock will cause a ______ Phillips curve. a) movement along the; shift left of the b) movement along the; shift right of the c) shift right of the; shift right of the d) shift left of the; shift right of thearrow_forwardThe cost of reducing inflation is believed to be minimized when: a) The central bank's disinflation policy is seen as highly credible b) The central bank's disinflation policy utilizes changes in money supply c) The economy is in a recession d) The economy experiences a supply shockarrow_forward
- What is the key variable that Friedman and Phelps added to the inflation-unemployment tradeoff analysis? a) Natural rate of unemployment b) Expected inflation c) Sticky wages d) Aggregate supply shocksarrow_forwardChapter 12 Homework 3. Productivity and growth policies Consider a hypothetical small island nation in which the only industry is cloud computing. The following table displays information about the economy over a two year period. Complete the table by calculating physical capital per worker as well as labor productivity. Hint: Recall that productivity is defined as the amount of goods and services a worker can produce per hour. In this problem, measure productivity as the quantity of goods per hour of labor. Physical Labor Capital Force (Servers) (Workers) Physical Capital per Worker (Servers) Labor Hours (Hours) Year Output (TB of data storage) Labor Productivity (TB of data storage per hour of labor) 2035 120 60 2036 400 100 3,000 3,500 21,000 49,000 Based on your calculations, productivity from 2035 to 2036. in physical capital per worker from 2035 to 2036 is associated with in labor Suppose you're in charge of establishing economic policy for this small island country. Which of the…arrow_forwardNote: Chat GPT or any AI keeps getting this question wrong. Question is in the image below.arrow_forward
 Economics (MindTap Course List)EconomicsISBN:9781337617383Author:Roger A. ArnoldPublisher:Cengage Learning

 Microeconomics: Private and Public Choice (MindTa...EconomicsISBN:9781305506893Author:James D. Gwartney, Richard L. Stroup, Russell S. Sobel, David A. MacphersonPublisher:Cengage Learning
 Macroeconomics: Private and Public Choice (MindTa...EconomicsISBN:9781305506756Author:James D. Gwartney, Richard L. Stroup, Russell S. Sobel, David A. MacphersonPublisher:Cengage Learning
 Economics: Private and Public Choice (MindTap Cou...EconomicsISBN:9781305506725Author:James D. Gwartney, Richard L. Stroup, Russell S. Sobel, David A. MacphersonPublisher:Cengage Learning


