
The question requires us to draw a hypothetical demand curve and label the variables.
Explanation of Solution
The following table represents the hypothetical
| Quantity demanded | Price |
| 12 | $10 |
| 20 | $5 |
The following graph represents the demand curve:
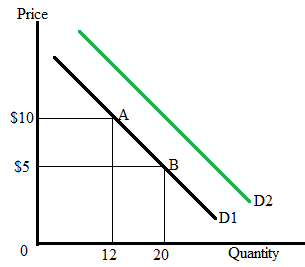
Here, D1 is the initial market demand for apple which is downward sloping and following the ‘
An increase in demand will shift the demand curve rightward from D1 to D2 as shown in the above graph.
According to the law of demand, there is an inverse relationship between the quantity demanded and the price of the product. A price increase will reduce the demand for the product and vice versa.
Chapter 5 Solutions
Krugman's Economics For The Ap® Course


 Principles of Economics (12th Edition)EconomicsISBN:9780134078779Author:Karl E. Case, Ray C. Fair, Sharon E. OsterPublisher:PEARSON
 Engineering Economy (17th Edition)EconomicsISBN:9780134870069Author:William G. Sullivan, Elin M. Wicks, C. Patrick KoellingPublisher:PEARSON
 Principles of Economics (MindTap Course List)EconomicsISBN:9781305585126Author:N. Gregory MankiwPublisher:Cengage Learning
 Managerial Economics: A Problem Solving ApproachEconomicsISBN:9781337106665Author:Luke M. Froeb, Brian T. McCann, Michael R. Ward, Mike ShorPublisher:Cengage Learning
 Managerial Economics & Business Strategy (Mcgraw-...EconomicsISBN:9781259290619Author:Michael Baye, Jeff PrincePublisher:McGraw-Hill Education