EBK BUSINESS ANALYTICS
3rd Edition
ISBN: 9780135231906
Author: Evans
Publisher: VST
expand_more
expand_more
format_list_bulleted
Concept explainers
Videos
Textbook Question
Chapter 5, Problem 14PE
A Canadian business school summarized the gender and residency of its incoming class as follows:
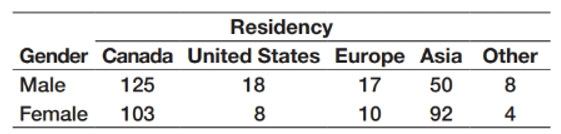
- Construct a joint
probability table. - Calculate the marginal probabilities.
- What is the probability that a female student is from outside Canada or the United States?
Expert Solution & Answer
Want to see the full answer?
Check out a sample textbook solution
Students have asked these similar questions
Life insurance companies make use of the laws of probability in order to
A) Estimate future death rates among members of a given group
B) Predict when an individual insured will die
C) Develop statistics of past deaths among the general population
D) Determine the experienced death rate among the insured persons
A national survey indicated that 30% of adults conduct their banking online. It also found that 40% are under the age of 50, and that 25% are under the age of 50 and conduct their banking online.
A. What is the probability that an individual conducts banking online given that the individual is under the age of 50?
B. Are Banking Online and Age independent? Explain.
Use the below formula to calculate the CLV for the following:
A manager of a cable company wants to determine if it is strategic to acquire the Brett family, by estimating their household-level CLV. The manager estimates that it will cost the company $80 (A) to get the Bretts’ to switch, and the Bretts’ will generate $150 profit each year (M), with a $30 annual marketing cost to retain them (C). The estimated retention rate (r) is 65%, and the current discount rate is 5%.(d)
i) CLV=
ii) Based on your calculation, are the Brett’s profitable to the cable company?
Chapter 5 Solutions
EBK BUSINESS ANALYTICS
Ch. 5 - Lauren drinks a variety of soft drinks. Over the...Ch. 5 - A home improvement company in Cincinnati ran a...Ch. 5 - Consider the experiment of drawing two cards...Ch. 5 - Three coins are drop on a table. List all possible...Ch. 5 - A market research company surveyed consumers to...Ch. 5 - Refer to the card scenario described in Problem 3....Ch. 5 - Refer to the coin scenario described in Problem 4....Ch. 5 - Prob. 8PECh. 5 - Prob. 9PECh. 5 - An airline tracks data on its flight arrivals....
Ch. 5 - A survey of 200 college graduates who have been...Ch. 5 - Prob. 12PECh. 5 - A survey of shopping habits found the percentage...Ch. 5 - A Canadian business school summarized the gender...Ch. 5 - Prob. 15PECh. 5 - Use the Civilian Labor Force data in the Excel...Ch. 5 - Prob. 17PECh. 5 - A home pregnancy test is not always accurate....Ch. 5 - In the scenario in Problem 3, what is the...Ch. 5 - In the roulette example described in Problem 8,...Ch. 5 - Prob. 21PECh. 5 - An investor estimates that there is a 1in10 chance...Ch. 5 - The weekly demand of a slow-moving product has the...Ch. 5 - Construct the probability distribution for the...Ch. 5 - Based on the data in the Excel file Consumer...Ch. 5 - A major application of analytics in marketing is...Ch. 5 - The Excel file Call Center Data shows that in a...Ch. 5 - If a cell phone company conducted a telemarketing...Ch. 5 - During one year, a particular mutual fund...Ch. 5 - A popular resort hotel has 300 rooms and is...Ch. 5 - A telephone call center where people place...Ch. 5 - A financial consultant has an average of eight...Ch. 5 - The number and frequency of Atlantic hurricanes...Ch. 5 - Prob. 34PECh. 5 - Prob. 35PECh. 5 - Prob. 36PECh. 5 - In determining automobile mileage ratings, it was...Ch. 5 - The distribution of SAT scores in math for an...Ch. 5 - A popular soft drink is sold in 2-liter...Ch. 5 - A supplier contract calls for a key dimension of a...Ch. 5 - Historical data show that customers who download...Ch. 5 - A lightbulb is warranted to last for 5,000 hours....Ch. 5 - The actual delivery time from Giodannis Pizza is...Ch. 5 - Apply the chi-square goodness of fit test to the...Ch. 5 - Apply the chi-square goodness of fit test to the...Ch. 5 - Compute the daily change of the closing price for...
Knowledge Booster


Learn more about
Need a deep-dive on the concept behind this application? Look no further. Learn more about this topic, subject and related others by exploring similar questions and additional content below.Similar questions
- A random sample of 10,000 customers was selected over a six month period. The data provides information on their current status with the bank as well as 12 additional attributes describing their demographic and banking information. what are the key predictors the bank should be aware of with their customers? Examples are included, but not limited to:Are female customers leaving more than males? Is there indication of customer departures associated with specific countries?Is there evidence of salary associated departures? what is an appropiate marketing strategy to attract and retain long term customersarrow_forwardAttendance at Orlando's newest Disneylike attraction, Lego World, has been as follows Quarter Guests (in thousands) Quarter Summer Year 2 Winter Year 1 58 99 Fall Year 2 149 Winter Year 3 Spring Year 1 Summer Year 1 Fal Year 1 Winter Year 2 75 Spring Year 3 63 Summer Year 3 Spring Year 21 82 Fall Year 3 Based on the given attendance, the seasonal indices for each of the seasons are (round your responses to three decimal places) Season Index Winter Spring Summer Fall 0000 Guests (in thousands) 125 54 99 146 210 99arrow_forwardAttendance at Orlando's newest Disneylike attraction, Lego World, has been as follows: Guests (in thousands) Quarter Winter Year 1 Spring Year 1 Summer Year 1 Fall Year 1 Winter Year 2 Spring Year 2 63 94 168 75 64 83 Season Quarter Winter Summer Year 2 Fall Year 2 Winter Year 3 Spring Year 3 Summer Year 3 Fall Year 3 Based on the given attendance, the seasonal indices for each of the seasons are (round your responses to three decimal places): Guests (in thousands) Index 124 51 94 151 210 99arrow_forward
- how is a time series module and a causal model used in a business?arrow_forwardFor the E-Commerce Retail Sales (Million$) data given in the table below, provide estimates from the 1st Quarter (Q1) of 2016 to the 3rd Quarter (Q3) of 2017 by using two models: 1) Single Exponential Smoothing with α=0.3 2) Moving Average with k=2. Calculate MAPE for each model. Quarter Year Actual Q1 2016 86802 Q2 2016 92004 Q3 2016 93795 Q4 2016 124651 Q1 2017 99491 Q2 2017 106590 Q3 2017 108291 Compare two models above (Single Exponential Smoothing and Moving Average) based on their accuracies. Which forecasting method appears to be better? Using the model you choose, provide forecast for the 4th Quarter (Q4) of 2017. Assuming that this model is overestimating, find the actual value of the Q4 of 2017 based on MAPE value. Some residual graphs from the first forecast model (including wider range of E-Commerce Retail Sales data) are given below. What do these graphs tell about the model? Explain each graph.arrow_forwardAttendance at Orlando's newest Disneylike attraction, Lego World, has been as follows: Quarter Guests (in thousands) Quarter Guests (in thousands) Winter Year 1 63 Summer Year 2 120 Spring Year 1 99 Fall Year 2 54 Summer Year 1 149 Winter Year 3 94 Fall Year 1 75 Spring Year 3 151 Winter Year 2 64 Summer Year 3 210 Spring Year 2 83 Fall Year 3 99 Part 2 Based on the given attendance, the seasonal indices for each of the seasons are (round your responses to three decimal places): Season Index Winter enter your response herearrow_forward
- As employees leave a company, they are asked to rate their level of job satisfaction during the time they were employed by the company. A sample set of scores (out of a maximum of 10) is provided below. 3 6 4 4 5 2 1 3 2 5 3 7 2 2 3 1 9 1 Use the information provided in the table to calculate: The median; The mode; The mean; The lower quartile (Q1); The upper quartile (Q3); The interquartile range (IQR); The standard deviation. State whether or not the ex-employees were likely to have left the company as a result of lack of job satisfaction. Use the statistics above to justify your conclusion. Discuss in which ways the company could benefit from making these statistics available to its current employees.arrow_forwardAttendance at Orlando's newest Disneylike attraction, Lego World, has been as follows: Quarter Winter Year 1 Spring Year 1 Summer Year 11 Fall Year 1 Guests (in thousands) 68 99 149 75 65 84 Quarter Summer Year 2 Fall Year 2 Winter Winter Year 3 Spring Year 3 Summer Year 3 Fall Year 3 Guests (in thousands) 120 51 99 151 Winter Year 2 207 Spring Year 2 97 Based on the given attendance, the seasonal indices for each of the seasons are (round your responses to three decimal places): Season Indexarrow_forwardIn November 2023, a certified investment property appraiser was hired to appraise the value of a 72,000 square foot Safeway anchored neighborhood shopping center in Fremont, California that was last sold in 2014 to a foreign investment company based in the Cayman Islands for $26 million. The November 2023 appraised value represents the: a. Actual market value of that property b. Actual purchase price of that property c. Actual replacement cost of that property d. Actual opinion of value by that appraiserarrow_forward
- According to Runzheimer International, a typical business traveler spends an average of $281 per day in Chicago. This cost includes hotel, meals, car rental, and incidentals. A survey of 70 randomly selected business travelers who have been to Chicago on business recently is taken. For the population mean of $281 per day, what is the probability of getting a sample average of more than $266 per day if the population standard deviation is $47? Appendix A Statistical Tables https://education.wiley.com/was/ui/v2/assessment-player/index.html?launchId=2333882f-0c41-4ee5-8a4b-7f87d5b49481# (Round the values of z to 2 decimal places, e.g. 15.25. Round your answer to 4 decimal places, e.g. 0.2513.)arrow_forwardIn a study of the domestic market share of three major automobile manufacturers A, B and C in a certain country, it was found out that of the customers who bought a car manufactured by A, 75% would again buy a car manufactured by A, 15% would buy a car manufactured by B and the rest wouldbuyacarmanufacturedbyC.OfthecustomerswhoboughtacarmanufacturedbyB,90% would again buy a car manufactured by B, 5% would buy a car manufactured by A and the rest would buy a car manufactured by C. Of the customers who bought a car manufactured by C, 85% would again buy a car manufactured by C, 5% would buy a car manufactured by A and the rest would buy a car manufactured by B. Required The long run market share of the manufacturersarrow_forwardA national survey indicated that 30% of adults conduct their banking online. It also found that 40% are under the age of 50, and that 25% are under the age of 50 and conduct their banking online. A. What percentage of adults do not conduct their banking online? B. What type of probability is the 25% mentioned above? Just write down the name of the probability. C. Construct a joint probability table showing all joint and marginal probabilities.arrow_forward
arrow_back_ios
SEE MORE QUESTIONS
arrow_forward_ios
Recommended textbooks for you
 BUSN 11 Introduction to Business Student EditionBusinessISBN:9781337407137Author:KellyPublisher:Cengage Learning
 Essentials of Business Communication (MindTap Cou...BusinessISBN:9781337386494Author:Mary Ellen Guffey, Dana LoewyPublisher:Cengage Learning
 Accounting Information Systems (14th Edition)BusinessISBN:9780134474021Author:Marshall B. Romney, Paul J. SteinbartPublisher:PEARSON
 International Business: Competing in the Global M...BusinessISBN:9781259929441Author:Charles W. L. Hill Dr, G. Tomas M. HultPublisher:McGraw-Hill Education
BUSN 11 Introduction to Business Student Edition
Business
ISBN:9781337407137
Author:Kelly
Publisher:Cengage Learning
Essentials of Business Communication (MindTap Cou...
Business
ISBN:9781337386494
Author:Mary Ellen Guffey, Dana Loewy
Publisher:Cengage Learning
Accounting Information Systems (14th Edition)
Business
ISBN:9780134474021
Author:Marshall B. Romney, Paul J. Steinbart
Publisher:PEARSON
International Business: Competing in the Global M...
Business
ISBN:9781259929441
Author:Charles W. L. Hill Dr, G. Tomas M. Hult
Publisher:McGraw-Hill Education
Probability & Statistics (28 of 62) Basic Definitions and Symbols Summarized; Author: Michel van Biezen;https://www.youtube.com/watch?v=21V9WBJLAL8;License: Standard YouTube License, CC-BY
Introduction to Probability, Basic Overview - Sample Space, & Tree Diagrams; Author: The Organic Chemistry Tutor;https://www.youtube.com/watch?v=SkidyDQuupA;License: Standard YouTube License, CC-BY