
(A)
To draw:
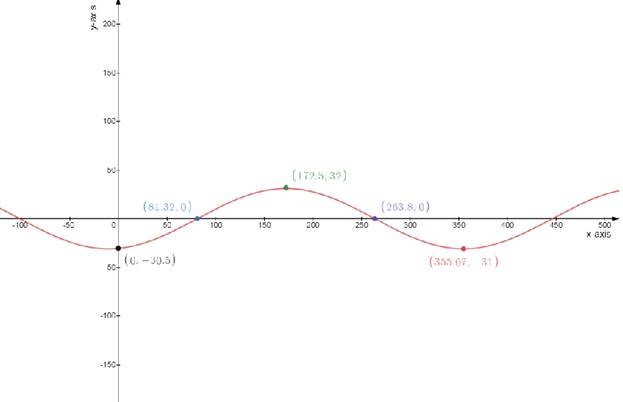
The graph of of the days
(A)
Explanation of Solution
Given:
The position of the sun
Concept used:
Replace the inequality sign and sketch the graph of the resulting equation (use a dashed line for < or > and a solid line for
Test one point in each of the region formed by the graph
If the point satisfies the inequality then shade the entire region to denote that every point in the region satisfies the inequality
Calculation:
To draw the table
Test one point in each of the region formed by the graph
If the point satisfies the inequality then shade the entire region to denote that every point in the region satisfies the inequality
To draw the graph

(B)
To draw:
The graph of of the days
(B)
Explanation of Solution
Given:
The position of the sun
Concept used:
Replace the inequality sign and sketch the graph of the resulting equation (use a dashed line for < or > and a solid line for
Test one point in each of the region formed by the graph
If the point satisfies the inequality then shade the entire region to denote that every point in the region satisfies the inequality
Calculation:
To draw the table
Test one point in each of the region formed by the graph
If the point satisfies the inequality then shade the entire region to denote that every point in the region satisfies the inequality
To draw the graph
(C)
The greatest and least numbers of hours of daylight
(C)
Explanation of Solution
Given:
The numbers of hours of daylight
Concept used:
Replace the inequality sign and sketch the graph of the resulting equation (use a dashed line for < or > and a solid line for
Test one point in each of the region formed by the graph
If the point satisfies the inequality then shade the entire region to denote that every point in the region satisfies the inequality
Calculation:
The numbers of hours of daylight
(D)
The period for new orleans
(D)
Explanation of Solution
Given:
The numbers of hours of daylight
Concept used:
Replace the inequality sign and sketch the graph of the resulting equation (use a dashed line for < or > and a solid line for
Test one point in each of the region formed by the graph
If the point satisfies the inequality then shade the entire region to denote that every point in the region satisfies the inequality
Calculation:
The numbers of hours of daylight
Chapter 5 Solutions
EBK PRECALCULUS W/LIMITS

 Calculus: Early TranscendentalsCalculusISBN:9781285741550Author:James StewartPublisher:Cengage Learning
 Thomas' Calculus (14th Edition)CalculusISBN:9780134438986Author:Joel R. Hass, Christopher E. Heil, Maurice D. WeirPublisher:PEARSON
 Calculus: Early Transcendentals (3rd Edition)CalculusISBN:9780134763644Author:William L. Briggs, Lyle Cochran, Bernard Gillett, Eric SchulzPublisher:PEARSON
 Calculus: Early TranscendentalsCalculusISBN:9781319050740Author:Jon Rogawski, Colin Adams, Robert FranzosaPublisher:W. H. Freeman
 Calculus: Early Transcendental FunctionsCalculusISBN:9781337552516Author:Ron Larson, Bruce H. EdwardsPublisher:Cengage Learning