
a.
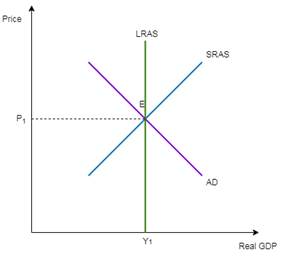
To draw: Labeled graph of aggregate demand and
a.
Explanation of Solution
In the graph shown below, SRAS and LRAS represents the short-run aggregate and long run
Graph 1
Supply and demand curve: Supply curve refers to the line that represents the relationship between the price of the product and the quantity that can be supplied by the producer. Demand curve refers to the relationship between price and the output at which consumers are ready to purchase.
b.
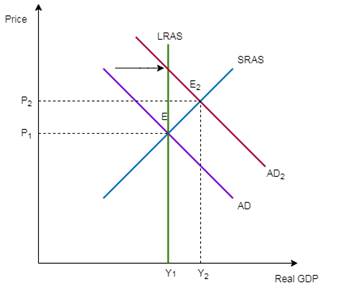
The impact of increased transfer payment along with the new
b.
Explanation of Solution
If government increased the transfer payment for the families with dependent children, then there will be overall increase in real GDP as price is increased to P2 with increased real GDP. This will result in new equilibrium represented by E2 at Y2.
Graph 2
Supply and demand curve: Supply curve refers to the line that represents the relationship between the price of the product and the quantity that can be supplied by the producer. Demand curve refers to the relationship between price and the output at which consumers are ready to purchase.
c.
The new equilibrium in short-run along with the appropriate fiscal policy that can be beneficial for output gap issue.
c.
Explanation of Solution
i)
An inflationary gap can be seen if new shore-run equilibrium resulted because as aggregate output increased from Y1 to Y2? and the aggregate price level increase from P1 to P2 and
ii)
The fiscal policy that would be suitable for an economy that is going through an inflationary gap is contractionary type. As it will put equilibrium back to normal.
Supply and demand curve: Supply curve refers to the line that represents the relationship between the price of the product and the quantity that can be supplied by the producer. Demand curve refers to the relationship between price and the output at which consumers are ready to purchase.
Chapter 4R Solutions
Krugman's Economics For The Ap® Course


 Principles of Economics (12th Edition)EconomicsISBN:9780134078779Author:Karl E. Case, Ray C. Fair, Sharon E. OsterPublisher:PEARSON
 Engineering Economy (17th Edition)EconomicsISBN:9780134870069Author:William G. Sullivan, Elin M. Wicks, C. Patrick KoellingPublisher:PEARSON
 Principles of Economics (MindTap Course List)EconomicsISBN:9781305585126Author:N. Gregory MankiwPublisher:Cengage Learning
 Managerial Economics: A Problem Solving ApproachEconomicsISBN:9781337106665Author:Luke M. Froeb, Brian T. McCann, Michael R. Ward, Mike ShorPublisher:Cengage Learning
 Managerial Economics & Business Strategy (Mcgraw-...EconomicsISBN:9781259290619Author:Michael Baye, Jeff PrincePublisher:McGraw-Hill Education