
Concept explainers
Videos
Suppose that a particular plot of land can sustain 500 deer and that the population of this particular species of deer can be modeled according to the logistic model as
Each year, a proportion of the herd deer is sold to petting zoos.
a. Find the function that gives the equilibrium population for various proportions.
b. Determine the maximum number of deer that should be sold to petting zoos each year. (Hint: Find the maximum sustainable harvest)
a.
To find:
The function that represents equilibrium population for various proportions.
Answer to Problem 1EA
Solution:
The function that represents equilibrium population for various proportions is
Explanation of Solution
Given:
The logistic model for a particular species of deer is given by
Calculation:
The equilibrium population is reached when the logistic model is zero.
Therefore, the function that represents equilibrium population for various proportions is
Also, the points at which the equilibrium population can be attained is computed as follows:
b.
The maximum number of deer that should be sold each year.
Answer to Problem 1EA
Solution:
The maximum number of deer that should be sold to petting zoos each year is 250.
Explanation of Solution
Given:
The logistic model for a particular species of deer is given by
Calculation:
Using the graphing utility, the graph of the given function is obtained as follows:
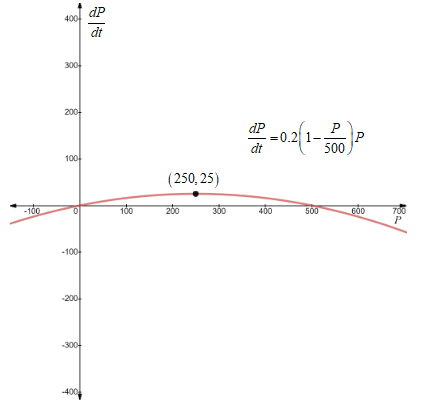
From the graph, it is observed that the function attains its maximum at the point
Hence, the maximum number of deer that should be sold to petting zoos each year is 250 to sustain the population.
Want to see more full solutions like this?
Chapter 4 Solutions
Calculus For The Life Sciences
Additional Math Textbook Solutions
Calculus & Its Applications (14th Edition)
Precalculus (10th Edition)
Calculus, Single Variable: Early Transcendentals (3rd Edition)
Single Variable Calculus: Early Transcendentals (2nd Edition) - Standalone book
Precalculus: Concepts Through Functions, A Unit Circle Approach to Trigonometry (4th Edition)
Calculus Early Transcendentals, Binder Ready Version


- The population of a culture of bacteria is modeled by the logistic equation P(t)=14,2501+29e0.62t where t is inarrow_forwardTable 6 shows the population, in thousands, of harbor seals in the Wadden Sea over the years 1997 to 2012. a. Let x represent time in years starting with x=0 for the year 1997. Let y represent the number of seals in thousands. Use logistic regression to fit a model to these data. b. Use the model to predict the seal population for the year 2020. c. To the nearest whole number, what is the limiting value of this model?arrow_forwardWhat does the y -intercept on the graph of a logistic equation correspond to for a population modeled by that equation?arrow_forward
- To the nearest whole number, what is the initial value of a population modeled by the logistic equation P(t)=1751+6.995e0.68t ? What is the carrying capacity?arrow_forwardEnter the data from Table 2 into a graphing calculator and graph the ranking scatter plot. Determine whetherthe data from the table would likely represent a function that is linear, exponential, or logarithmic.arrow_forward
 Calculus For The Life SciencesCalculusISBN:9780321964038Author:GREENWELL, Raymond N., RITCHEY, Nathan P., Lial, Margaret L.Publisher:Pearson Addison Wesley,
 Glencoe Algebra 1, Student Edition, 9780079039897...AlgebraISBN:9780079039897Author:CarterPublisher:McGraw Hill
 Algebra & Trigonometry with Analytic GeometryAlgebraISBN:9781133382119Author:SwokowskiPublisher:Cengage