
To sketch: the graph of the function for the interval 0≤x≤41, and to describe the public school enrollment changes over this period of time.
Answer to Problem 48E
The public school enrollment increases in interval o<t<11.66 and 29.8<t<41 . The public school enrollment decreases in interval 11.66<t<29.8 . The maximum enrollment is 44970.93 and minimum is 40078.21.
Explanation of Solution
Given information:
The function,
S=1.64x3−102x2+1710x+36300
The number S of students enrolled in public schools in a certain country can be modeled, where x is time.
Calculation:
Input function using key 1.64X∧3−102Xx2+1710X+36300 .
The display is shown below:
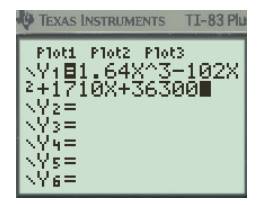
Adjust the WINDOW and hit GRAPH key.
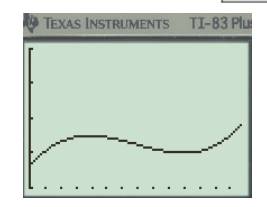
Press 2ndTRACE to go the CALCULATE menu and highlight the Maximum and press ENTER.
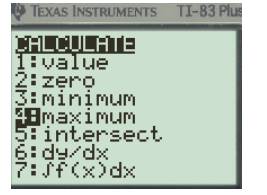
When asked for left bound and right bound, move cursor to the left or right of observed Maximum location.
When asked for Guess, simply Hit ENTER key.
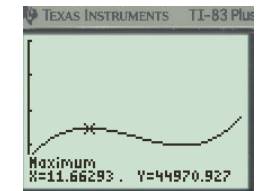
Therefore,
Press 2ndTRACE to go the CALCULATE menu and highlight the Minimum and press ENTER.
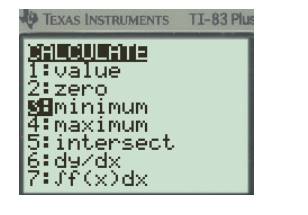
When asked for left bound and right bound, move cursor to the left or right of observed Maximum location.
When asked for Guess, simply Hit ENTER key.
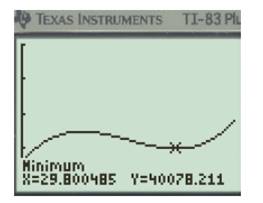
Therefore,
Therefore, the public school enrollment increases in interval o<t<11.66 and 29.8<t<41 . The public school enrollment decreases in interval 11.66<t<29.8 . The maximum enrollment is 44970.93 and minimum is 40078.21.
Chapter 4 Solutions
Big Ideas Math A Bridge To Success Algebra 2: Student Edition 2015
- The functions f(x) = –4x + 5 and g(x) = x3 + x2 – 4x + 5 are given.Part A: What type of functions are f(x) and g(x)? Justify your answer.Part B: Find the domain and range for f(x) and g(x). Then compare the domains and compare the ranges of the functions.arrow_forwarda) IS AU B is independence linear Show that A and B also independence linear or hot and why, write. Example. 6) 18 M., M2 X and dim(x)=n and dim M, dim M₂7 Show that Mi M₂+ {0} and why? c) let M Me X and {X.,... xr} is beas of M, and {y,, ., un} is beas of M₂ and {x, xr, Menyuzis beas of X Show that X = M₁ M2 d) 15 M₁ = {(x, y, z, w) | x+y=0, Z=2W} CR" M₂ = (X, Y, Z, W)/x+Y+Z=0}arrow_forwardThe function f(x) is shown on the graph. ာ 2 3 2 f(x) 1 0 -1 -2 1 -3 -4 -5 2 3 4t Which type of function describes f(x)? Exponential O Logarithmic O Polynomial ○ Rationalarrow_forward
- 1. For the following subsets of R3, explain whether or not they are a subspace of R³. (a) (b) 1.1 0.65 U = span -3.4 0.23 0.4 -0.44 0 (})} a V {(2) | ER (c) Z= the points in the z-axisarrow_forwardSolve the following equation forx. leave answer in Simplified radical form. 5x²-4x-3=6arrow_forwardMATCHING LIST Question 6 Listen Use the given equations and their discriminants to match them to the type and number of solutions. 00 ed two irrational solutions a. x²+10x-2=-24 two rational solutions b. 8x²+11x-3=7 one rational solution c. 3x²+2x+7=2 two non-real solutions d. x²+12x+45 = 9 DELL FLOWER CHILD 10/20 All Changes S $681 22991arrow_forward
- 88 MULTIPLE CHOICE Question 7 Listen The following irrational expression is given in unsimplified form with four op- tions in simplified form. Select the correct simplified form. Select only one option. A 2±3√√2 B 4±√3 2±√ √3 D 1±√√3 DELL FLOWER CHILD 11/200 4 ± √48 4 ✓ All Changes Saved 165arrow_forwardUse the graph of y = f(x) to answer the following. 3- 2 -4 -2 -1 1 2 3 4 -1 2 m -3- + (d) Find all x for which f(x) = -2. If there is more than one value, separate them with commas or write your answer in interval notation, if necessary. Select "None", if applicable. Value(s) of x for which f(x)=-2: | (0,0) (0,0) (0,0) (0,0) 0,0... -00 None (h) Determine the range of f. The range is (0,0) Garrow_forwardWhat is g(f(4))arrow_forward
- 10) Multiply (8m + 3)² A) 8m²+11m+6 B) m² + 48m+9 C) 64m²+48m+9 D) 16m²+11m+6arrow_forwardLet R be field and X= R³/s Vector space over R M=(a,b,c)labic, e Rra+b= 3- <3 Show that Ms and why with proof. 1) is convexset and affine set of botost ii) is blanced set and symmetirs set of x iii) is hy per space and hyper plane ofx or hot iii) find f:MR st kerf = M 18/103 and finnd fiM→R/{0} st M= {xEX, f(t) = x, texiαER? jiii) show that Mis Maxsubspace or not and Mis a max. affine set or not.arrow_forwardFind The partial fraction decomposition for each The following 2× B) (x+3) a 3 6 X-3x+2x-6arrow_forward
 Algebra and Trigonometry (6th Edition)AlgebraISBN:9780134463216Author:Robert F. BlitzerPublisher:PEARSON
 Contemporary Abstract AlgebraAlgebraISBN:9781305657960Author:Joseph GallianPublisher:Cengage Learning
 Linear Algebra: A Modern IntroductionAlgebraISBN:9781285463247Author:David PoolePublisher:Cengage Learning
 Algebra And Trigonometry (11th Edition)AlgebraISBN:9780135163078Author:Michael SullivanPublisher:PEARSON
 Introduction to Linear Algebra, Fifth EditionAlgebraISBN:9780980232776Author:Gilbert StrangPublisher:Wellesley-Cambridge Press
 College Algebra (Collegiate Math)AlgebraISBN:9780077836344Author:Julie Miller, Donna GerkenPublisher:McGraw-Hill Education


