Concept explainers
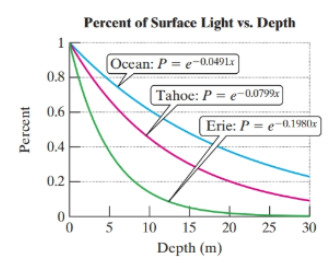
Sunlight is absorbed in water, and as a result the light intensity in oceans, lakes, and ponds decreases exponentially with depth. The percentage of visible light, P (in decimal form), at a depth of x meters is given by

Determine the depth at which the light intensity is 20% of the value from the surface for each body of water given. Round to the nearest tenth of a meter.
Want to see the full answer?
Check out a sample textbook solution
Chapter 4 Solutions
ALEKS 360 COL.ALG (18 WEEK) >ACCESS<
Additional Math Textbook Solutions
Linear Algebra with Applications (2-Download)
Algebra and Trigonometry (6th Edition)
Algebra And Trigonometry (11th Edition)
Algebra 1, Homework Practice Workbook (MERRILL ALGEBRA 1)
College Algebra Essentials
Intermediate Algebra (12th Edition)
- Table 3 gives the annual sales (in millions of dollars) of a product from 1998 to 20006. What was the average rate of change of annual sales (a) between 2001 and 2002, and (b) between 2001 and 2004?arrow_forwardTable 6 shows the population, in thousands, of harbor seals in the Wadden Sea over the years 1997 to 2012. a. Let x represent time in years starting with x=0 for the year 1997. Let y represent the number of seals in thousands. Use logistic regression to fit a model to these data. b. Use the model to predict the seal population for the year 2020. c. To the nearest whole number, what is the limiting value of this model?arrow_forwardTable 4 gives the population of a town (in thousand) from 2000 to 2008. What was the average rate of change of population (a) between 2002 and 2004, and (b) between 2002 and 2006?arrow_forward
- Table 6 shows the year and the number ofpeople unemployed in a particular city for several years. Determine whether the trend appears linear. If so, and assuming the trend continues, in what year will the number of unemployed reach 5 people?arrow_forwardThe half-life of plutonium-244 is 80,000,000 years. Find function gives the amount of carbon-14 remaining as a function of time, measured in years.arrow_forwardTable 2 shows a recent graduate’s credit card balance each month after graduation. a. Use exponential regression to fit a model to these data. b. If spending continues at this rate, what will the graduate’s credit card debt be one year after graduating?arrow_forward
- Use the table of values you made in part 4 of the example to find the limiting value of the average rate of change in velocity.arrow_forwardsolve a,b,c and d given in the image provided.arrow_forwardEngineers concerned about a tower's stability have done extensive studies of its increasing tilt. Measurements of the lean of the tower over time provide much useful information. The following table gives measurements for the years 1975 to 1987. The variable "lean" represents the difference between where a point on the tower would be if the tower were straight and where it actually is. The data are coded as tenths of a millimeter in excess of 2.9 meters, so that the 1975 lean, which was 2.9647 meters, appears in the table as 647. Only the last two digits of the year were entered into the computer. 80 83 86 75 76 77 78 647 649 660 672 79 81 82 84 85 678 693 701 703 717 722 729 747 (a) Plot the data. Consider whether or not the trend in lean over time appears to be linear. (Do this on paper. Your instructor may ask you to turn in this graph.) Year Lean (b) What is the equation of the least-squares line? (Round your answers to three decimal places.) y = X x + x x What percent of the…arrow_forward
- the operating expesnes of amazon increased from 3.6 billion in 2008 to 16.3 billion in 2012. use the information to find a linear model for amazons operating expesne E as a function of time t in years since 2010arrow_forwardLuis is investigating how long his phone's battery lasts (in hours) for various brightness levels (on a scale of 0-100). His data is displayed in the table and graph below. Brightness Level (x) 31 33 43 76 81 85 91 95 Hours (y) 4.6 3.2 5.6 2.9 3.1 3.1 2 5- 10 20 30 40 50 60 70 80 90 100 11 Brightness Level a) Find the equation for the line of best fit. Keep at least 4 decimals for each parameter in the equation. b) Interpret the slope in context. O Luis should expect -0.0331 hours per brightness level. O Luis should expect -0.0331 brightness level per hour. c) What does the equation predict for the number of hours the phone will last at a brightness level of 43? hours Hoursarrow_forwardManuel is investigating how long his phone's battery lasts (in hours) for various brightness levels (on a scale of 0-100). His data is displayed in the table and graph below. Brightness Level (x) 30 49 65 67 69 80 85 85 Hours (y) 6.6 4.6 4.1 4.3 3.5 2.8 3.1 10+ 7 2 10 20 30 40 60 70 80 100 Brightness Level a) Find the equation for the line of best fit. Keep at least 4 decimals for each parameter in the equation. SANOHarrow_forward
 Algebra & Trigonometry with Analytic GeometryAlgebraISBN:9781133382119Author:SwokowskiPublisher:Cengage
 Algebra: Structure And Method, Book 1AlgebraISBN:9780395977224Author:Richard G. Brown, Mary P. Dolciani, Robert H. Sorgenfrey, William L. ColePublisher:McDougal Littell
 Glencoe Algebra 1, Student Edition, 9780079039897...AlgebraISBN:9780079039897Author:CarterPublisher:McGraw Hill
 College AlgebraAlgebraISBN:9781305115545Author:James Stewart, Lothar Redlin, Saleem WatsonPublisher:Cengage Learning
 Functions and Change: A Modeling Approach to Coll...AlgebraISBN:9781337111348Author:Bruce Crauder, Benny Evans, Alan NoellPublisher:Cengage Learning


