
a)
The graph that shows the domestic supply and demand for rice in country M.
a)
Explanation of Solution
The following graph shows the domestic supply and demand for rice in country M.
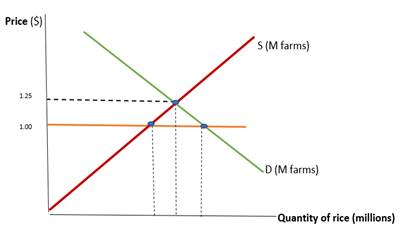
In the graph, the vertical axis represents the price and the horizontal axis shows the quantity of rice. The demand is on a downward slope and the supply of country M’s farm is on an upward slope. This demand and supply are shown at prices $1.25 and $1.
Introduction: A global decentralized market for trading currencies is known as the foreign exchange market and for every currency, the foreign exchange rates are set by this market.
b)
Labeling of no-trade equilibrium along with the trade equilibrium on the graph.
b)
Explanation of Solution
Labeling of no-trade equilibrium along with the trade equilibrium on the graph will be shown as:
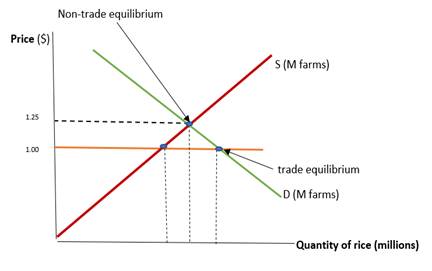
Non-trade equilibrium is found and labeled on the graph where the price is $1.25 and trade equilibrium is on point in the graph where the price is $1, which is equal to the demand for rice.
Introduction: A global decentralized market for trading currencies is known as the foreign exchange market and for every currency, the foreign exchange rates are set by this market.
c)
The portions of the horizontal axis that show the quantity of rice that is imported at world price and supplied domestically at the whole world.
c)
Explanation of Solution
The portions of the horizontal axis that show the quantity of rice that is imported at world price and supplied domestically at the whole world can be shown on the graph as:
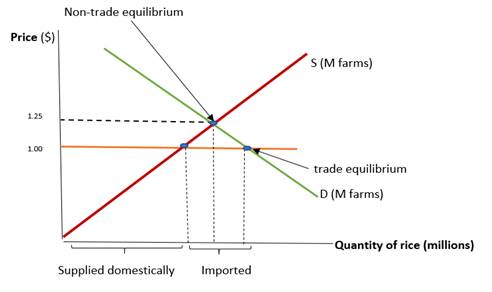
The brackets are used to show the quantity of rice that is imported at world price and supplied domestically in the whole world.
Introduction: A global decentralized market for trading currencies is known as the foreign exchange market and for every currency, the foreign exchange rates are set by this market.
d)
New trade equilibrium and shaded area of total tariff revenue when country M imposes a tariff of US $0.15 per pound of rice that is imported.
d)
Explanation of Solution
New trade equilibrium and shaded area of total tariff revenue when country M imposes a tariff of US $0.15 per pound of rice which is imported as shown on the graph:
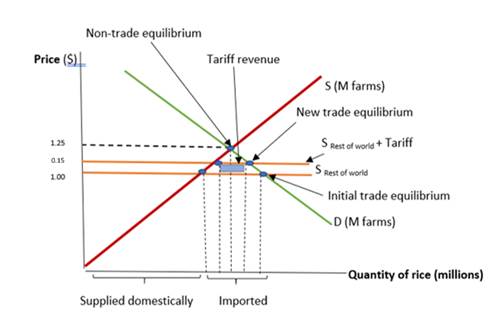
Horizontal S Rest of world + tariff curve shows the new equilibrium.
A new trade equilibrium is found and labeled at a price of US $0.15 and the shaded area shows the total tariff revenue when country M imposes a tariff at this price for each pound of imported rice.
Introduction: A global decentralized market for trading currencies is known as the foreign exchange market and for every currency, the foreign exchange rates are set by this market.
Chapter 44 Solutions
Krugman's Economics For The Ap® Course


 Principles of Economics (12th Edition)EconomicsISBN:9780134078779Author:Karl E. Case, Ray C. Fair, Sharon E. OsterPublisher:PEARSON
 Engineering Economy (17th Edition)EconomicsISBN:9780134870069Author:William G. Sullivan, Elin M. Wicks, C. Patrick KoellingPublisher:PEARSON
 Principles of Economics (MindTap Course List)EconomicsISBN:9781305585126Author:N. Gregory MankiwPublisher:Cengage Learning
 Managerial Economics: A Problem Solving ApproachEconomicsISBN:9781337106665Author:Luke M. Froeb, Brian T. McCann, Michael R. Ward, Mike ShorPublisher:Cengage Learning
 Managerial Economics & Business Strategy (Mcgraw-...EconomicsISBN:9781259290619Author:Michael Baye, Jeff PrincePublisher:McGraw-Hill Education