
Concept explainers
Videos
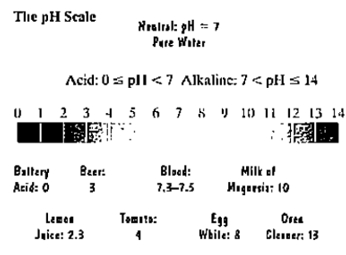
The pH scale is used to measure the acidity or alkalinity of a solution. The scale ranges from 0 to 14. A neutral solution, such as pure miter, has a pH of 7. An acid solution has a pH less than 7 and an alkaline solution has a pH greater than 7. The lower the pH below 7, the more acidic is the solution. Each whole-number decrease in pH represents a tenfold increase in acidity.
The pH of a solution is given by
a. The figure indicates that lemon juice has a pH of 23. What is the hydrogen ion concentration?
b. Stomach acid has a pH that ranges from 1 to 3. What is the hydrogen ion concentration of the most acidic stomach?
c. How many times greater is the hydrogen ion concentration of the acidic stomach in part (b) than the lemon juice in part (a)?
Want to see the full answer?
Check out a sample textbook solution
Chapter 4 Solutions
ALGEBRA+TRIGONOMETRY


- Heart Disease In a certain country, the number of deaths due to heart disease decreased from 235 in one year to 221 in the next year. What percentage decrease in deaths due to heart disease does this represent?arrow_forwardThe resistance of a copper wire carrying an electrical current is directly proportional to its length and inversely proportional to its cross-sectional area. A copper wire with a diameter of 0.0126inch has a resistance of 64.9ohms per thousand feet. What length of 0.0201-inch-diameter copper wire will produce a resistance of 33.5ohms?arrow_forwardEach row represents an experimental “run” (in this case, averaged sample of mango wine). Column A shows the run number; Column B shows the percentage of ethanol; Column C shows the amount of glycerol (in g/L); Column D shows the amount of acid (in g/L); Column E shows the temperature of the run (in °C); and Column F shows the pH of the run. 1. a. What is/are the appropriate measure(s) of central tendency for each of the variables in Columns B-F? Explain your answers in no more than two sentences each. b. Calculate the measures of central tendencies above. c. Graph each variable using a histogram; label the above measures of central tendency with a red vertical line if you chose the mean, a blue line if you chose the median, and a purple line if you chose the mode. 2. Create a scatterplot of the ethanol data for all 20 runs (do not include the imaginary run in Question 3). a. Draw a graphical representation of the model that you chose to use. b. Comparing the model to…arrow_forward
- Emissions of sulfur dioxide by industry set off chemical changes in the atmosphere that result in "acid rain". The acidity of liquids is measured by pH on a scale of 00 to 14.14. Distilled water has pH 7.0,7.0, and lower pH values indicate acidity. Normal rain is somewhat acidic, so "acid rain" is sometimes defined as rainfall with a pH below 5.0.5.0. The pH of rain at one location varies among rainy days according to a Normal distribution with mean 5.435.43 and standard deviations 0.54.0.54. What proportion of rainy days have rainfall with pH below 5.0?5.0? Use software or Table A to find the answer. (Enter your answer rounded to four decimal places.) proportion:arrow_forwardEmissions of sulfur dioxide by industry set off chemical changes in the atmosphere that result in "acid rain". The acidity of liquids is measured by pH on a scale of 00 to 14.14. Distilled water has pH 7.0,7.0, and lower pH values indicate acidity. Normal rain is somewhat acidic, so "acid rain" is sometimes defined as rainfall with a pH below 5.0.5.0. The pH of rain at one location varies among rainy days according to a Normal distribution with mean 5.43 and standard deviations 0.54. What proportion of rainy days have rainfall with pH below 5.0?5.0?arrow_forwardJanet measured the number of fluid ounces of water in a container after being left outdoors each day for a week. The changes in the number of fluid ounces of water in the container in relation to the original amount are displayed below. Water Measure Changes Day Monday Tuesday Wednesday Thursday Friday Saturday Sunday Change in fluid ounces -9/10 5/6 -9/10 -4/5 1/6 -1 1/5 7/10 Find the average change in the amount of water in the container after being left outdoors each day for a week. F 5 1/2fluid ounces G 11/14 fluid ounces H -2 1/10 fluid ounces J -3/10fluid ouncesarrow_forward
- the pH of a solution is 5.8. What is the hydrogen ion contencentration? Hydrogen ion concentration[H+]= _______ moles per liter?arrow_forwardGas mileage actually varies slightly with the driving speed of a car (as well as with highway vs. city driving). Suppose your car averages 29 miles per gallon on the highway if your average speed is 48 miles per hour, and it averages 26 miles per gallon on the highway if your average speed is 65 miles per hour. Answer parts (a) and (b) below. a. What is the driving time for a 2300-mile trip if you drive at an average speed of 48 miles per hour? What is the driving time at 65 miles per hour? The driving time at 48 miles per hour is hours. (Type an integer or decimal rounded to two decimal places as needed.) The driving time is at 65 miles per hour is (Round to two decimal places as needed.) b. Assume a gasoline price of $4.43 per gallon. What is the gasoline cost for a 2300-mile trip if you drive at an average speed of 48 miles per hour? What is the gasoline cost at 65 miles per hour? The gasoline cost at 48 miles per hour is $ (Round to two decimal places as needed.) hours. The…arrow_forwardASAParrow_forward
- The peak temperature in summer in Antarctica is (or used to be until recently. . . )arrow_forwardThe peak flow rate of a person is the fastest rate at which the person can expel air after taking a deep breath.Peak flow rate is measured in units of liters per minute and gives an indication of the person’s respiratoryhealth. Researchers measured peak flow rate and height for each of a sample of 17 men. The results are givenin the table. (image included) a. Create a scatterplot displaying the relationship between peak flow rate and height.b. Calculate the sample correlation coefficient for peak flow rate and height.c. If we were to predict the peak flow rate using height with a least-squares regression model, whatis the slope estimate ˆb?d. Continuing with part a, what is the intercept estimate ˆa?e. Based on the regression model, what is the predicted peak flow rate for a subject that is 175cmtall?f. Looking at the original data, subject 8 is 175cm tall with a peak flow rate of 670l/min. What isthe residual for this subject?g. Fit the least-squares model in R. What is the…arrow_forwardAcidity is measured on the pH scale. The acidity of a substance is given by pH=−logH, where H is the concentration of Hydrogen ions.If a substance has an H value of 0.00032, which shows a valid step in the process of calculating the pH of the substance?arrow_forward
 Holt Mcdougal Larson Pre-algebra: Student Edition...AlgebraISBN:9780547587776Author:HOLT MCDOUGALPublisher:HOLT MCDOUGAL
 Glencoe Algebra 1, Student Edition, 9780079039897...AlgebraISBN:9780079039897Author:CarterPublisher:McGraw Hill
 Functions and Change: A Modeling Approach to Coll...AlgebraISBN:9781337111348Author:Bruce Crauder, Benny Evans, Alan NoellPublisher:Cengage Learning
 Algebra: Structure And Method, Book 1AlgebraISBN:9780395977224Author:Richard G. Brown, Mary P. Dolciani, Robert H. Sorgenfrey, William L. ColePublisher:McDougal Littell