
Concept explainers
Videos
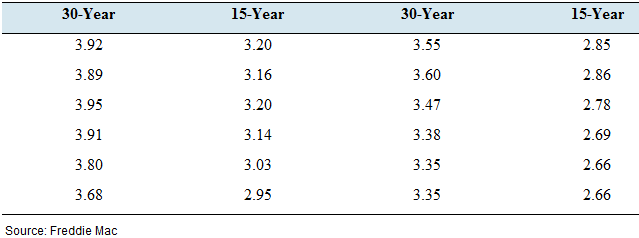
Mortgage payments: The following table presents interest rates, in percent, for 30-year and
15-year fixed-rate mortgages, for January through December, 2012.
- Compute the least-squares regression line for predicting the 15-year rate from the 30-year rate.
- Construct a scatter-plot of the 15-year rate (y) versus the 30-year rate (x). Graph the least-squares regression line on the same axes.
- Is it possible to interpret die y-intercept? Explain.
- If the 30-year rate differs by 0.3 percent from one month to the next, by how much would you predict the 15-year rate to differ?
- Predict the 15-year rate for a month when the 30-year rate is 3.5 percent.
a.
To compute:The least squares regression line for the
Answer to Problem 26E
The least square regression line of the given data set is,
Explanation of Solution
The mortgage rate for
Calculation:
The least-square regression is given by the formula,
Where
The correlation coefficient is given by the formula,
Let
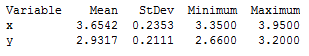
The correlation coefficient can be obtained by the following table.
Hence, the correlation coefficient is,
Then, the coefficient
Therefore,
Conclusion:
The least square regression line is found to be,
b.
To graph:The scatter plot for the two mortgage rates.
Explanation of Solution
Graph:
Taking the
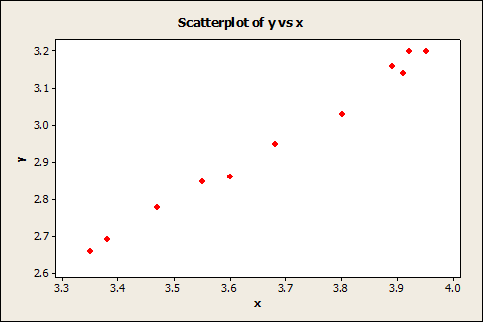
Interpretation:
We can clearly observe that there is a strong linear relationship between these two parameters in the positive direction.
c.
To explain:The interpretation of the
Answer to Problem 26E
No, the
Explanation of Solution
The lease-square regression line has been computed in the part (a) s,
By the constant
The
Note that a rate of mortgage cannot be negative.
Conclusion:
Therefore, the
d.
To calculate:The difference in the percentage of the
Answer to Problem 26E
The
Explanation of Solution
The lease-square regression line has been computed in the part (a) s,
Calculation:
Let the initial
Also, the increased rate should be
Simplifying the obtained weight,
Therefore, the difference of two weights should be,
Interpretation:
According to the calculation, the
e.
To find:The predicted
Answer to Problem 26E
When
Explanation of Solution
Calculation:
When the
By substituting this value into the least-square regression line of the relationship, we can obtain the corresponding
Conclusion:
The predicted
Want to see more full solutions like this?
Chapter 4 Solutions
Connect Hosted by ALEKS Access Card or Elementary Statistics


- What is regression analysis? Describe the process of performing regression analysis on a graphing utility.arrow_forwardIf your graphing calculator is capable of computing a least-squares sinusoidal regression model, use it to find a second model for the data. Graph this new equation along with your first model. How do they compare?arrow_forwardDoes Table 1 represent a linear function? If so, finda linear equation that models the data.arrow_forward
- Find the equation of the regression line for the following data set. x 1 2 3 y 0 3 4arrow_forwardLife Expectancy The following table shows the average life expectancy, in years, of a child born in the given year42 Life expectancy 2005 77.6 2007 78.1 2009 78.5 2011 78.7 2013 78.8 a. Find the equation of the regression line, and explain the meaning of its slope. b. Plot the data points and the regression line. c. Explain in practical terms the meaning of the slope of the regression line. d. Based on the trend of the regression line, what do you predict as the life expectancy of a child born in 2019? e. Based on the trend of the regression line, what do you predict as the life expectancy of a child born in 1580?2300arrow_forward
 Functions and Change: A Modeling Approach to Coll...AlgebraISBN:9781337111348Author:Bruce Crauder, Benny Evans, Alan NoellPublisher:Cengage Learning
 Calculus For The Life SciencesCalculusISBN:9780321964038Author:GREENWELL, Raymond N., RITCHEY, Nathan P., Lial, Margaret L.Publisher:Pearson Addison Wesley,
 Algebra & Trigonometry with Analytic GeometryAlgebraISBN:9781133382119Author:SwokowskiPublisher:Cengage
 Glencoe Algebra 1, Student Edition, 9780079039897...AlgebraISBN:9780079039897Author:CarterPublisher:McGraw Hill
 Trigonometry (MindTap Course List)TrigonometryISBN:9781305652224Author:Charles P. McKeague, Mark D. TurnerPublisher:Cengage Learning
 Algebra and Trigonometry (MindTap Course List)AlgebraISBN:9781305071742Author:James Stewart, Lothar Redlin, Saleem WatsonPublisher:Cengage Learning