
ELEMENTARY STATISTICS(LL)(FD)
3rd Edition
ISBN: 9781260707458
Author: Navidi
Publisher: MCGRAW-HILL CUSTOM PUBLISHING
expand_more
expand_more
format_list_bulleted
Concept explainers
Videos
Textbook Question
Chapter 4.2, Problem 25E
Foot temperatures: Foot ulcers are a common problem for people with diabetes. Higher skin temperatures on the foot indicate an increased risk of ulcers. In a study carried out at the Colorado School of Mines, skin temperatures on both feet were measured, in degrees Fahrenheit, for 18 diabetic patients. The results are presented in the following table.
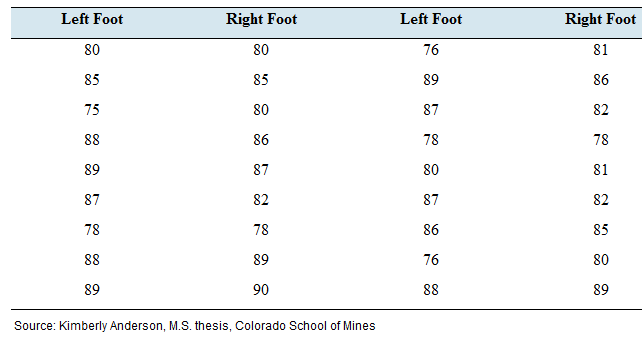
- Compute due least-squares regression line for predicting right foot temperature from the left foot temperature.
- Construct a scatter-plot (y) versus the left foot temperature Graph the least-squares regression line on the same axes.
- If the left foot temperatures of two patients differ by 2 degrees: by how much would you predict their right foot temperatures to differ?
- Predict the right foot temperature for a patient whose left foot temperature is 81 degrees.
Expert Solution & Answer
Want to see the full answer?
Check out a sample textbook solution
Students have asked these similar questions
Draw a scatterplot of the right foot temperature (y) versus the left foot temperature (x). Then draw the least-squares
regression line on the graph.
We have data from 209 publicly traded companies (circa 2010) indicating sales and compensation
information at the firm-level. We are interested in predicting a company's sales based on the CEO's
salary. The variable sales; represents firm i's annual sales in millions of dollars. The variable
salary; represents the salary of a firm i's CEO in thousands of dollars. We use least-squares to
estimate the linear regression
sales; = a + ßsalary; + ei
and get the following regression results:
regress sales salary
.
Source
Model
Residual
Total
sales
salary
_cons
SS
337920405
2.3180e+10
2.3518e+10
df
1
207
208
Coef. Std. Err.
.9287785 .5346574
5733.917 1002.477
MS
337920405
111980203
113066454
t
Number of obs
F(1, 207)
Prob> F
R-squared
Adj R-squared
Root MSE
P>|t|
1.74 0.084
5.72 0.000
209
3.02
-.1252934
3757.543
0.0838
0.0144
0.0096
10582
[95% Conf. Interval]
1.98285
7710.291
This output tells us the regression line equation is sales = 5,733.917 +0.9287785 salary.
Suppose a CEO of a company…
We have data from 209 publicly traded companies (circa 2010) indicating sales and compensation
information at the firm-level. We are interested in predicting a company's sales based on the CEO's
salary. The variable sales; represents firm i's annual sales in millions of dollars. The variable
salary; represents the salary of a firm i's CEO in thousands of dollars. We use least-squares to
estimate the linear regression
sales; = a + ßsalary; + ei
and get the following regression results:
. regress sales salary
Source
Model
Residual
Total
sales
salary
cons
SS
337920405
2.3180e+10
2.3518e+10
df
1
207
208
Coef. Std. Err.
.9287785 .5346574
5733.917 1002.477
MS
337920405
111980203
113066454
Number of obs
F (1, 207)
Prob > F
R-squared
t P>|t|
=
Adj R-squared =
Root MSE
1.74 0.084
5.72 0.000
=
=
-.1252934
3757.543
=
209
3.02
0.0838
0.0144
0.0096
10582
[95% Conf. Interval]
1.98285
7710.291
This output tells us the regression line equation is sales = 5,733.917 +0.9287785 salary.
Interpret the…
Chapter 4 Solutions
ELEMENTARY STATISTICS(LL)(FD)
Ch. 4.1 - In Exercises 9-12, fill in each blank with the...Ch. 4.1 - In Exercises 9-12, fill in each blank with the...Ch. 4.1 - In Exercises 9-12, fill in each blank with the...Ch. 4.1 - In Exercises 9-12, fill in each blank with the...Ch. 4.1 - Prob. 13ECh. 4.1 - Prob. 14ECh. 4.1 - In Exercises 13-16, determine whether the...Ch. 4.1 - In Exercises 13-16, determine whether the...Ch. 4.1 - In Exercises 17-20, compute the correlation...Ch. 4.1 - In Exercises 17-20, compute the correlation...
Ch. 4.1 - In Exercises 17-20, compute the correlation...Ch. 4.1 - In Exercises 17-20, compute the correlation...Ch. 4.1 - In Exercises 21-24, determine whether the...Ch. 4.1 - In Exercises 21-24, determine whether the...Ch. 4.1 - In Exercises 21-24, determine whether the...Ch. 4.1 - In Exercises 21-24, determine whether the...Ch. 4.1 - In Exercises 25-30, determine whether the...Ch. 4.1 - In Exercises 25-30, determine whether the...Ch. 4.1 - In Exercises 25-30, determine whether the...Ch. 4.1 - In Exercises 25-30, determine whether the...Ch. 4.1 - In Exercises 25-30, determine whether the...Ch. 4.1 - In Exercises 25-30, determine whether the...Ch. 4.1 - Price of eggs and milk: The following table...Ch. 4.1 - Government funding: The following table presents...Ch. 4.1 - Pass the ball: The following table lists the...Ch. 4.1 - Carbon footprint: Carbon dioxide (CO2) is produced...Ch. 4.1 - Foot temperatures: Foot ulcers are a common...Ch. 4.1 - Mortgage payments: The following table presents...Ch. 4.1 - Blood pressure: A blood pressure measurement...Ch. 4.1 - Prob. 38ECh. 4.1 - Police and crime: In a survey of cities in the...Ch. 4.1 - Age and education: A survey of U.S. adults showed...Ch. 4.1 - Whats the correlation? In a sample of adults, the...Ch. 4.1 - Prob. 42ECh. 4.1 - Changing means and standard deviations: A small...Ch. 4.2 - In Exercises 5-7, fill in each blank with the...Ch. 4.2 - In Exercises 5-7, fill in each blank with the...Ch. 4.2 - In Exercises 5-7, fill in each blank with the...Ch. 4.2 - Prob. 8ECh. 4.2 - Prob. 9ECh. 4.2 - Prob. 10ECh. 4.2 - Prob. 11ECh. 4.2 - Prob. 12ECh. 4.2 - In Exercises 13-16, compute the least-squares...Ch. 4.2 - In Exercises 13-16, compute the least-squares...Ch. 4.2 - In Exercises 13-16, compute the least-squares...Ch. 4.2 - In Exercises 13-16, compute the least-squares...Ch. 4.2 - Compute the least-squares regression he for...Ch. 4.2 - Compute the least-squares regression he for...Ch. 4.2 - In a hypothetical study of the relationship...Ch. 4.2 - Assume in a study of educational level in years...Ch. 4.2 - Price of eggs and milk: The following table...Ch. 4.2 - Government funding: The following table presents...Ch. 4.2 - Pass the ball: The following table lists the...Ch. 4.2 - Carbon footprint: Carbon dioxide (CO2) is produced...Ch. 4.2 - Foot temperatures: Foot ulcers are a common...Ch. 4.2 - Mortgage payments: The following table presents...Ch. 4.2 - Blood pressure: A blood pressure measurement...Ch. 4.2 - Butterfly wings: Do larger butterflies live...Ch. 4.2 - Interpreting technology: The following display...Ch. 4.2 - Interpreting technology: The following display...Ch. 4.2 - Interpreting technology: The following MINITAB...Ch. 4.2 - Interpreting technology: The following MINITAB...Ch. 4.2 - Prob. 33ECh. 4.2 - Prob. 34ECh. 4.2 - Least-squares regression line for z-scores: The...Ch. 4.3 - In Exercises 5-10, fill in each blank with the...Ch. 4.3 - In Exercises 5-10, fill in each blank with the...Ch. 4.3 - In Exercises 5-10, fill in each blank with the...Ch. 4.3 - In Exercises 5-10, fill in each blank with the...Ch. 4.3 - In Exercises 5-10, fill in each blank with the...Ch. 4.3 - Prob. 10ECh. 4.3 - Prob. 11ECh. 4.3 - In Exercises 11-14, determine whether the...Ch. 4.3 - Prob. 13ECh. 4.3 - In Exercises 11-14, determine whether the...Ch. 4.3 - For the following data set: Compute the...Ch. 4.3 - For the following data set: Compute the...Ch. 4.3 - For the following data set: Compute the...Ch. 4.3 - For the following data set: Compute the...Ch. 4.3 - Prob. 19ECh. 4.3 - Prob. 20ECh. 4.3 - Prob. 21ECh. 4.3 - Prob. 22ECh. 4.3 - Hot enough for you? The following table presents...Ch. 4.3 - Presidents and first ladies: The presents the ages...Ch. 4.3 - Mutant genes: In a study to determine whether the...Ch. 4.3 - Imports and exports: The following table presents...Ch. 4.3 - Energy consumption: The following table presents...Ch. 4.3 - Cost of health care: The following table presents...Ch. 4.3 - Prob. 29ECh. 4.3 - Prob. 30ECh. 4.3 - Prob. 31ECh. 4.3 - Transforming a variable: The following table...Ch. 4.3 - Prob. 33ECh. 4.3 - Prob. 34ECh. 4 - Compute the correlation coefficient for the...Ch. 4 - The number of theaters showing the movie Monsters...Ch. 4 - Use the data in Exercise 2 to compute the...Ch. 4 - A scatterplot has a correlation of r=1. Describe...Ch. 4 - Prob. 5CQCh. 4 - Prob. 6CQCh. 4 - Use the least-squares regression line computed in...Ch. 4 - Use the least-squares regression line computed in...Ch. 4 - Prob. 9CQCh. 4 - A scatterplot has a least-squares regression line...Ch. 4 - Prob. 11CQCh. 4 - Prob. 12CQCh. 4 - A sample of students was studied to determine the...Ch. 4 - In a scatter-plot; the point (-2, 7) is...Ch. 4 - The correlation coefficient for a data set is...Ch. 4 - Prob. 1RECh. 4 - Prob. 2RECh. 4 - Hows your mileage? Weight (in tons) and fuel...Ch. 4 - Prob. 4RECh. 4 - Energy efficiency: A sample of 10 households was...Ch. 4 - Energy efficiency: Using the data in Exercise 5:...Ch. 4 - Prob. 7RECh. 4 - Prob. 8RECh. 4 - Prob. 9RECh. 4 - Prob. 10RECh. 4 - Baby weights: The average gestational age (time...Ch. 4 - Commute times: Every morning, Tania leaves for...Ch. 4 - Prob. 13RECh. 4 - Prob. 14RECh. 4 - Prob. 15RECh. 4 - Describe an example which two variables are...Ch. 4 - Two variables x and y have a positive association...Ch. 4 - Prob. 3WAICh. 4 - Prob. 4WAICh. 4 - Prob. 5WAICh. 4 - Prob. 6WAICh. 4 - Prob. 7WAICh. 4 - Prob. 8WAICh. 4 - Prob. 9WAICh. 4 - The following table, reproduced from the chapter...Ch. 4 - Prob. 2CSCh. 4 - Prob. 3CSCh. 4 - Prob. 4CSCh. 4 - Prob. 5CSCh. 4 - Prob. 6CSCh. 4 - Prob. 7CSCh. 4 - Prob. 8CSCh. 4 - Prob. 9CSCh. 4 - Prob. 10CSCh. 4 - Prob. 11CSCh. 4 - Prob. 12CSCh. 4 - Prob. 13CSCh. 4 - If we are going to use data from this year to...Ch. 4 - Prob. 15CS
Knowledge Booster


Learn more about
Need a deep-dive on the concept behind this application? Look no further. Learn more about this topic, statistics and related others by exploring similar questions and additional content below.Similar questions
- Find the equation of the regression line for the following data set. x 1 2 3 y 0 3 4arrow_forwardOlympic Pole Vault The graph in Figure 7 indicates that in recent years the winning Olympic men’s pole vault height has fallen below the value predicted by the regression line in Example 2. This might have occurred because when the pole vault was a new event there was much room for improvement in vaulters’ performances, whereas now even the best training can produce only incremental advances. Let’s see whether concentrating on more recent results gives a better predictor of future records. (a) Use the data in Table 2 (page 176) to complete the table of winning pole vault heights shown in the margin. (Note that we are using x=0 to correspond to the year 1972, where this restricted data set begins.) (b) Find the regression line for the data in part ‚(a). (c) Plot the data and the regression line on the same axes. Does the regression line seem to provide a good model for the data? (d) What does the regression line predict as the winning pole vault height for the 2012 Olympics? Compare this predicted value to the actual 2012 winning height of 5.97 m, as described on page 177. Has this new regression line provided a better prediction than the line in Example 2?arrow_forwardWhat does the y -intercept on the graph of a logistic equation correspond to for a population modeled by that equation?arrow_forward
- The data in the table represent the number of licensed drivers in various age groups and the number of fatal accidents within the age group by gender. Complete parts (a) to (c) below. ..... (a) Find the least-squares regression line for males treating the number of licensed drivers as the explanatory variable, x, and the number of fatal crashes, y, as the response variable. Repeat this procedure for females. Find the least-squares regression line for males. y=x+O Data for licensed drivers by age and gender. (Round the slope to three decimal places and round the constant to the nearest integer as needed.) Find the least-squares regression line for females. x + Number of Number of Number of Male Fatal Number of Female Fatal (Round the slope to three decimal places and round the constant to the nearest integer as needed.) Licensed Drivers Crashes Licensed Drivers Crashes (b) Interpret the slope of the least-squares regression line for each gender, if appropriate. How might an insurance…arrow_forwardThe data in the table represent the number of licensed drivers in various age groups and the number of fatal accidents within the age group by gender. Complete parts (a) through (c) below. Click the icon to view the data table. ..... (a) Find the least-squares regression line for males treating the number of licensed drivers as the explanatory variable, x, and the number of fatal crashes, y, as the response variable. Repeat this procedure for females. Find the least-squares regression line for males. y =x+O %D/ (Round the x coefficient to three decimal places as needed. Round the constant to the nearest integer as needed.) Find the least-squares regression line for females. y = ý =x+O %3D (Round the x coefficient to three decimal places as needed. Round the constant to the nearest integer as needed.) (b) Interpret the slope of the least-squares regression line for each gender, if appropriate. How might an insurance company use this information? What is the correct interpretation of the…arrow_forwardHelp please!arrow_forward
- Eleven states were randomly selected from among the 50 United States. This data represents the percentage of households in each state that are below the poverty level (Poverty Rate) based on household income and the percentage of adults in the state who had earned at least a high school degree (HS and Above). (a) Describe the relationship between the variables. (b) What is the slope of the least-squares regression line for this data? Interpret this value. (c) Predict the percent of adults who had attained at least a high school degree for the state with a poverty rate of 15%? Show your work. (d) Find the residual for the state with a poverty rate of 15%. Interpret the residual.arrow_forwardThe data in the table represent the number of licensed drivers in various age groups and the number of fatal accidents within the age group by gender. Complete parts (a) through (c) below. Click the icon to view the data table. ... . (a) Find the least-squares regression line for males treating the number of licensed drivers as the explanatory variable, x, and the number of fatal crashes, y, as the response variable. Repeat this procedure for females. Find the least-squares regression line for males. y=x+O Data for licensed drivers by age and gender. %3D (Round the x coefficient to three decimal places as needed. Round the constant to the nearest integer as needed.) Find the least-squares regression line for females. y = Number of Number o X+ Number of Male Fatal Number of Female Fatal (Round the x coefficient to three decimal places as needed. Round the constant to the nearest integer as needed.) Licensed Drivers Crashes Licensed Drivers Crashes (b) Interpret the slope of the…arrow_forwardWhat is the relationship between diamond price and carat size? 307 diamonds were sampled and a straight-line relationship was hypothesized between y = diamond price (in dollars) and x = size of the diamond (in carats). The simple linear regression for the analysis is shown below: Least Squares Linear Regression of PRICE Interpret the standard deviation of the regression model. a) We expect most of the sampled diamond prices to fall within $1117.56 of their least squares predicted values. b) We can explain 89.25% of the variation in the sampled diamond prices around their mean using the size of the diamond in a linear model. c) For every 1-carat increase in the size of a diamond, we estimate that the price of the diamond will increase by $1117.56. d) We expect most of the sampled diamond prices to fall within $2235.12 of their least squares predicted values.arrow_forward
- If all the points in a scatter diagram lie on the least squares regression line, what must be the coefficient of correlation equal toarrow_forwardIs CEO compensation related to a company's performance? To test whether CEO compensation and a company's stock performance are related, a financial analyst collected data on 12 randomly selected, publicly traded companies. For each company, the analyst looked at two variables: the percent change in stock price over the past five years (which she denoted x ) and the percent change in CEO compensation over the past five years (which she denoted y ). For these 12 companies, the least-squares regression equation relating the two variables was =y+−0.1650.046x , and the standard error of the slope of this least-squares regression line was approximately 0.028 . Using her information, test for a significant linear relationship between these two variables by doing a hypothesis test regarding the population slope β1 . (Assume that the variable y follows a normal distribution for each value of x and that the other regression assumptions are satisfied.) Use the…arrow_forwardExplain why the predictor variable is useless as a predictor of the response variable if the slope of the population regression line is 0.arrow_forward
arrow_back_ios
SEE MORE QUESTIONS
arrow_forward_ios
Recommended textbooks for you
 College AlgebraAlgebraISBN:9781305115545Author:James Stewart, Lothar Redlin, Saleem WatsonPublisher:Cengage Learning
 Algebra and Trigonometry (MindTap Course List)AlgebraISBN:9781305071742Author:James Stewart, Lothar Redlin, Saleem WatsonPublisher:Cengage Learning
 Linear Algebra: A Modern IntroductionAlgebraISBN:9781285463247Author:David PoolePublisher:Cengage Learning
 Glencoe Algebra 1, Student Edition, 9780079039897...AlgebraISBN:9780079039897Author:CarterPublisher:McGraw Hill
 Big Ideas Math A Bridge To Success Algebra 1: Stu...AlgebraISBN:9781680331141Author:HOUGHTON MIFFLIN HARCOURTPublisher:Houghton Mifflin Harcourt
College Algebra
Algebra
ISBN:9781305115545
Author:James Stewart, Lothar Redlin, Saleem Watson
Publisher:Cengage Learning
Algebra and Trigonometry (MindTap Course List)
Algebra
ISBN:9781305071742
Author:James Stewart, Lothar Redlin, Saleem Watson
Publisher:Cengage Learning
Linear Algebra: A Modern Introduction
Algebra
ISBN:9781285463247
Author:David Poole
Publisher:Cengage Learning
Glencoe Algebra 1, Student Edition, 9780079039897...
Algebra
ISBN:9780079039897
Author:Carter
Publisher:McGraw Hill
Big Ideas Math A Bridge To Success Algebra 1: Stu...
Algebra
ISBN:9781680331141
Author:HOUGHTON MIFFLIN HARCOURT
Publisher:Houghton Mifflin Harcourt
Correlation Vs Regression: Difference Between them with definition & Comparison Chart; Author: Key Differences;https://www.youtube.com/watch?v=Ou2QGSJVd0U;License: Standard YouTube License, CC-BY
Correlation and Regression: Concepts with Illustrative examples; Author: LEARN & APPLY : Lean and Six Sigma;https://www.youtube.com/watch?v=xTpHD5WLuoA;License: Standard YouTube License, CC-BY