
Fundamentals of Statistics (5th Edition)
5th Edition
ISBN: 9780134508306
Author: Michael Sullivan III
Publisher: PEARSON
expand_more
expand_more
format_list_bulleted
Videos
Textbook Question
Chapter 4.1, Problem 11AYU
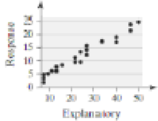
In Problems 9–12, determine whether the
11. 
Expert Solution & Answer

Trending nowThis is a popular solution!

Students have asked these similar questions
2. What are independent and dependent variables from this table ?
The data in the table can be entered into a calculator to determine a linear equation of best fit where x represents the elapsed time in minutes and y represents the depth of water in a tub in inches.
What conclusion can be drawn from the correlation coefficient?
A There is a weak positive correlation between the variables.
B There is a weak negative correlation between the variables.
C There is a strong positive correlation between the variables.
D There is a strong negative correlation between the variables.
In Problems 5–10, examine the scatter diagram and determine whether the type of relation is linear or nonlinear.
Chapter 4 Solutions
Fundamentals of Statistics (5th Edition)
Ch. 4.1 - What is the difference between univariate data and...Ch. 4.1 - The _____ variable is the variable whose value can...Ch. 4.1 - A _____ _____ is a graph that shows the relation...Ch. 4.1 - What does it mean to say two variables are...Ch. 4.1 - If r = _____, then a perfect negative linear...Ch. 4.1 - True or False: If the linear correlation...Ch. 4.1 - A _____ variable is a variable that is related to...Ch. 4.1 - True or False: Correlation implies causation.Ch. 4.1 - In Problems 912, determine whether the scatter...Ch. 4.1 - In Problems 912, determine whether the scatter...
Ch. 4.1 - In Problems 912, determine whether the scatter...Ch. 4.1 - In Problems 912, determine whether the scatter...Ch. 4.1 - NW Match the linear correlation coefficient to the...Ch. 4.1 - Match the linear correlation coefficient to the...Ch. 4.1 - Prob. 15AYUCh. 4.1 - Relation between Education and Birthrate? The...Ch. 4.1 - In Problems 1720, (a) draw a scatter diagram of...Ch. 4.1 - In Problems 1720, (a) draw a scatter diagram of...Ch. 4.1 - In Problems 1720, (a) draw a scatter diagram of...Ch. 4.1 - In Problems 1720, (a) draw a scatter diagram of...Ch. 4.1 - Name the Relation, Part I For each of the...Ch. 4.1 - Prob. 22AYUCh. 4.1 - The TIMMS Exam The Trends in International...Ch. 4.1 - Prob. 24AYUCh. 4.1 - NW An Unhealthy Commute The Gallup Organization...Ch. 4.1 - Credit Scores Your Fair Isaacs Corporation (FICO)...Ch. 4.1 - Height versus Head Circumference A pediatrician...Ch. 4.1 - American Black Bears The American black bear...Ch. 4.1 - Weight of a Car versus Miles per Gallon An...Ch. 4.1 - Hurricanes The data in the next column represent...Ch. 4.1 - CEO Performance The following data represent the...Ch. 4.1 - Bear Markets A bear market in the stock market is...Ch. 4.1 - Does Size Matter? Researchers wondered whether the...Ch. 4.1 - Prob. 34AYUCh. 4.1 - Weight of a Car versus Miles per Gallon Suppose...Ch. 4.1 - American Black Bears The website that contained...Ch. 4.1 - Draw Your Data! Consider the four data sets shown...Ch. 4.1 - Predicting Winning Percentage The ultimate goal in...Ch. 4.1 - Prob. 39AYUCh. 4.1 - Lyme Disease versus Drownings Lyme disease is an...Ch. 4.1 - Prob. 41AYUCh. 4.1 - Prob. 42AYUCh. 4.1 - Crime Rate and Cell Phones The linear correlation...Ch. 4.1 - Prob. 44AYUCh. 4.1 - Influential Consider the following set of data: a....Ch. 4.1 - Prob. 46AYUCh. 4.1 - Prob. 47AYUCh. 4.1 - Prob. 48AYUCh. 4.1 - What does it mean to say that the linear...Ch. 4.1 - What does it mean if r = 0?Ch. 4.1 - Prob. 51AYUCh. 4.1 - Prob. 52AYUCh. 4.1 - Explain the difference between correlation and...Ch. 4.1 - Suppose that two variables, x and y, are...Ch. 4.2 - The difference between the observed and predicted...Ch. 4.2 - If the linear correlation between two variables is...Ch. 4.2 - Prob. 3AYUCh. 4.2 - Prob. 4AYUCh. 4.2 - For the data set a. Draw a scatter diagram....Ch. 4.2 - For the data set a. Draw a scatter diagram....Ch. 4.2 - In Problems 712: a. By hand, draw a scatter...Ch. 4.2 - In Problems 712: a. By hand, draw a scatter...Ch. 4.2 - Prob. 9AYUCh. 4.2 - In Problems 712: a. By hand, draw a scatter...Ch. 4.2 - In Problems 712: a. By hand, draw a scatter...Ch. 4.2 - In Problems 712: a. By hand, draw a scatter...Ch. 4.2 - NW Income and Education In Problem 15 from Section...Ch. 4.2 - You Explain It! Study Time and Exam Scores After...Ch. 4.2 - Age Gap at Marriage Is there a relation between...Ch. 4.2 - You Explain It! CO2 and Energy Production The...Ch. 4.2 - NW An Unhealthy Commute (Refer to Problem 25,...Ch. 4.2 - Credit Scores (Refer to Problem 26, Section 4.1.)...Ch. 4.2 - Height versus Head Circumference (Refer to Problem...Ch. 4.2 - Prob. 20AYUCh. 4.2 - Weight of a Car versus Miles per Gallon (Refer to...Ch. 4.2 - Hurricanes (Refer to Problem 30, Section 4.1) The...Ch. 4.2 - Cola Consumption vs. Bone Density Example 5 in...Ch. 4.2 - Attending Class The following data represent the...Ch. 4.2 - CEO Performance (Refer to Problem 31 in Section...Ch. 4.2 - Bear Markets (Refer to Problem 32, Section 4.1) A...Ch. 4.2 - Male vs. Female Drivers (Refer to Problem 34,...Ch. 4.2 - Graduation Rates Go to...Ch. 4.2 - Putting It Together: Housing Prices One of the...Ch. 4.2 - Putting It Together: Smoking and Birth Weight It...Ch. 4.2 - What is a residual? What does it mean when a...Ch. 4.2 - Explain the phrase outside the scope of the model....Ch. 4.2 - Explain what each point on the least-squares...Ch. 4.3 - The _____ _____ _____, R2, measures the proportion...Ch. 4.3 - Total deviation = _____ deviation + _____...Ch. 4.3 - Match each coefficient of determination to a...Ch. 4.3 - NW The Other Old Faithful Perhaps you are familiar...Ch. 4.3 - Concrete As concrete cures, it gains strength. The...Ch. 4.3 - Prob. 7AYUCh. 4.3 - Problems 712 use the results from Problems 2530 in...Ch. 4.3 - Prob. 9AYUCh. 4.3 - Problems 712 use the results from Problems 2530 in...Ch. 4.3 - Problems 712 use the results from Problems 2530 in...Ch. 4.3 - Prob. 12AYUCh. 4.3 - Weight of a Car versus Miles per Gallon Suppose...Ch. 4.3 - American Black Bears Suppose that we find a bear...Ch. 4.3 - Putting It Together: Exam Scores The data below...Ch. 4.3 - Sullivan Survey II Go to...Ch. 4.4 - What is meant by a marginal distribution? What is...Ch. 4.4 - Refer to Table 8. Is constructing a conditional...Ch. 4.4 - Prob. 3AYUCh. 4.4 - Explain the idea behind Simpsons Paradox.Ch. 4.4 - In Problems 5 and 6, a. Construct a frequency...Ch. 4.4 - In Problems 5 and 6, a. Construct a frequency...Ch. 4.4 - Made in America In a recent Harris Poll, a random...Ch. 4.4 - Desirability Traits In a recent Harris Poll, a...Ch. 4.4 - NW Party Affiliation Is there an association...Ch. 4.4 - Prob. 10AYUCh. 4.4 - Health and Happiness The General Social Survey...Ch. 4.4 - Happy in Your Marriage? The General Social Survey...Ch. 4.4 - Prob. 13AYUCh. 4.4 - Treating Kidney Stones Researchers conducted a...Ch. 4.4 - Sullivan Survey II Go to...Ch. 4 - Basketball Spreads In sports betting, Las Vegas...Ch. 4 - Fat and Calories in Cheeseburgers A nutritionist...Ch. 4 - Prob. 3RECh. 4 - Prob. 4RECh. 4 - Prob. 5RECh. 4 - a. Draw a scatter diagram treating x as the...Ch. 4 - Use the results from Problems 2 and 4 to compute...Ch. 4 - Prob. 8RECh. 4 - Prob. 9RECh. 4 - New versus Used Car Satisfaction Are you more...Ch. 4 - Unemployment Rates Recessions are an economic...Ch. 4 - Prob. 12RECh. 4 - Prob. 13RECh. 4 - Prob. 1CTCh. 4 - Use the data from Problem 1. a. Find the...Ch. 4 - Use the results from Problems 1 and 2 to compute...Ch. 4 - The following data represent the speed of a car...Ch. 4 - Prob. 5CTCh. 4 - Prob. 6CTCh. 4 - Consider the following contingency table, which...Ch. 4 - What would you say about a set of quantitative...Ch. 4 - If the slope of a least-squares regression line is...Ch. 4 - What does it mean if a linear correlation...
Knowledge Booster


Learn more about
Need a deep-dive on the concept behind this application? Look no further. Learn more about this topic, statistics and related others by exploring similar questions and additional content below.Similar questions
- If a third variable is in fact a confounder of the relationship between two variables, it will always cause you to see an association that does not actually exist. True Falsearrow_forward2. In a simple regression analysis where Yisa dependent and an independent variable)if the Y intercept is positive then A. there is a positive relation between X and Y B. if Y is increased must also increase C. None D. if x increased y must also increasearrow_forwardExamine the scatter diagram and determine whether the type of relation is linear or nonlinear.arrow_forward
- 3. If X and Y have the relation X + Y = 2 then the correlation of X and Y (p) is -1. True or False? Give reasoning.arrow_forwardAn online clothing company is keeping track of their customers purchases. Company also offers a credit card where customers get additional offers if they use that card when they make purchases from their online store. For those customers who has their credit card, the company has additional information such as age, yearly income, etc. The company management is interested in looking at the relationship between the income (in 1000s of dollars) and the total yearly purchases from their store for these credit card holders . They have gathered this information from a random sample of 42 credit card holders. Below provided is a partial MINITAB output for predicting the yearly purchases from the income. Identify the response and the predictor variable in this study. Write the equation of the least squares regression line for predicting the total yearly purchase from the income of the customer. What percentage of variation in total yearly purchase is explained by income of the customer?…arrow_forwardA negative correlation between two variables, X and Y, indicates that: Group of answer choices as scores on X increase, scores on Y decrease as scores on X increase, scores on Y increase as scores on X decrease, scores on Y decrease no relationship between X and Yarrow_forward
- Suppose that the table shows the COVID-19 cases and deaths in some NCR cities during the COVID-19 surge. COVID-19 cases (X) COVID-19 deaths (Y) 820 8 560 6 470 2 680 4 660 5 1100 Jast] 15 a. What is the degree of linear relationship between COVID-19 cases and deaths? ✓ [Select ] 0.945 0.641 0.893 0.437arrow_forwardIf a linear relation exists between the variables x and y, then the coefficient of correlation between them is + 1 or – 1. |arrow_forwardThe table gives heavy - metal nuclear waste (in thousands of metric tons) from spent reactor fuel now stored temporarily at reactor sites, awaiting permanent storage. Waste y Year x 1995 32 2000 42 2010 61 2020 76 Let x = 0 represent 1995, x = 5 represent 2000 (since 2000 - 1995 = 5), and so on. a) For 1995, the ordered pair is (0, 32). Write the ordered pair for the data for the other years given in the table. b) Plot the ordered pairs (x,y). Do the points lie approximately in a straight line? c) Use the ordered pairs (0, 32) and (25, 76) to find the equation of a line that approximates the other ordered pairs. Write the equation in slope - intercept form and in standard form. d) Use the slope - intercept equation form from part (c) to estimate the amount of nuclear waste in 2005.arrow_forward
- 8. Melody and Adolfo gathered research data to predict the number of new types of plants (y) that will be in a state park after x years. After making a scatterplot of the data, they determined the equation of a line of best fit as: y = 0.25x +8 A. Does their equation indicate positive, negative, or no correlation? B. Based on this equation, how many types of plants were in the park when they started their research? C. Based on the equation, what is the number of new types of plants that will be in the park after 24 years? D. Based on the equation, how long would it take for there to be 12 new types of plants in the park?arrow_forwardHelp!! (c) If drinking an additional gram of alcohol each day raised the relative risk of breast cancer by exactly 0.01 , what would be the correlation between alcohol in wine intake and relative risk of breast cancer? A) There would be a poor quality, negative linear relationship. B) None of the options are correct. C) There would be a perfect, positive linear relationship. D) There would be a perfect, positive nonlinear relationship.arrow_forwardA Hong Kong snack-food vendor offers 3 types of boxed ”lunches to go,” priced at $3, $5, and $10, respectively. The vendor would like to establish whether there is a relationship between the price of the boxed lunch and the number of sales achieved per hour. Consequently, over a 15-day period the vendor records the number of sales made for each of the 3 types of boxed lunches. The following data show the boxed-lunch price (x) and the number sold (y) during each of the 15 lunch hours.(3, 7) (5, 5) (10, 2) (3, 9) (5, 6) (10, 5) (3, 6) (5, 6)(10, 1) (3, 10) (5, 7) (10, 4) (3, 5) (5, 6) (10, 4)Prepare a scatter plot of the points and comment on the relationship between the price of the boxed lunches and the numbers sold each lunchtime.arrow_forward
arrow_back_ios
SEE MORE QUESTIONS
arrow_forward_ios
Recommended textbooks for you
 MATLAB: An Introduction with ApplicationsStatisticsISBN:9781119256830Author:Amos GilatPublisher:John Wiley & Sons Inc
 Probability and Statistics for Engineering and th...StatisticsISBN:9781305251809Author:Jay L. DevorePublisher:Cengage Learning
 Statistics for The Behavioral Sciences (MindTap C...StatisticsISBN:9781305504912Author:Frederick J Gravetter, Larry B. WallnauPublisher:Cengage Learning
 Elementary Statistics: Picturing the World (7th E...StatisticsISBN:9780134683416Author:Ron Larson, Betsy FarberPublisher:PEARSON
 The Basic Practice of StatisticsStatisticsISBN:9781319042578Author:David S. Moore, William I. Notz, Michael A. FlignerPublisher:W. H. Freeman
 Introduction to the Practice of StatisticsStatisticsISBN:9781319013387Author:David S. Moore, George P. McCabe, Bruce A. CraigPublisher:W. H. Freeman
MATLAB: An Introduction with Applications
Statistics
ISBN:9781119256830
Author:Amos Gilat
Publisher:John Wiley & Sons Inc
Probability and Statistics for Engineering and th...
Statistics
ISBN:9781305251809
Author:Jay L. Devore
Publisher:Cengage Learning
Statistics for The Behavioral Sciences (MindTap C...
Statistics
ISBN:9781305504912
Author:Frederick J Gravetter, Larry B. Wallnau
Publisher:Cengage Learning
Elementary Statistics: Picturing the World (7th E...
Statistics
ISBN:9780134683416
Author:Ron Larson, Betsy Farber
Publisher:PEARSON
The Basic Practice of Statistics
Statistics
ISBN:9781319042578
Author:David S. Moore, William I. Notz, Michael A. Fligner
Publisher:W. H. Freeman
Introduction to the Practice of Statistics
Statistics
ISBN:9781319013387
Author:David S. Moore, George P. McCabe, Bruce A. Craig
Publisher:W. H. Freeman
What is a Relation? | Don't Memorise; Author: Don't Memorise;https://www.youtube.com/watch?v=hV1_wvsdJCE;License: Standard YouTube License, CC-BY
RELATIONS-DOMAIN, RANGE AND CO-DOMAIN (RELATIONS AND FUNCTIONS CBSE/ ISC MATHS); Author: Neha Agrawal Mathematically Inclined;https://www.youtube.com/watch?v=u4IQh46VoU4;License: Standard YouTube License, CC-BY