Definition Definition Representation of the direction and degree of correlation in graphical form. The grouping of points that are plotted makes it a scatter diagram. A line can be drawn showing the relationship based on the direction of points and their distance from each other.
Chapter 4.1, Problem 111AYU
(a)
To determine
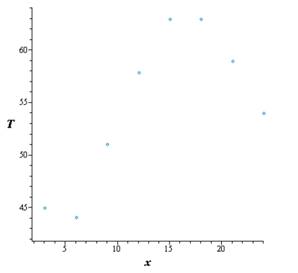
To draw: a scatter diagram of the given data.
(a)
Expert Solution
Answer to Problem 111AYU
Explanation of Solution
Given:
Hours after Midnight, x
Temperature (°F), T
3
45.0
6
44.1
9
51.1
12
57.9
15
63.0
18
63.0
21
59.0
24
54.0
Calculation:
The scatter diagram for the above data is as follows.
By observing the above graph it can be seen that the relation between the variables is cubic.
Conclusion:
Therefore, the scatter diagram is drawn.
(b)
To determine
To find: the average rate of change in temperature
(b)
Expert Solution
Answer to Problem 111AYU
The average rate of change in temperature is 2.27°F/h
Explanation of Solution
Calculation:
The change in temperature from 9 AM to 12 noon is as follows
57.9°F−51.1°F=6.8°F
Therefore the average rate of change in temperature is 6.8°F÷3h=2.27°F/h
Conclusion:
Therefore the average rate of change in temperature is 2.27°F/h
(c)
To determine
To find: the average rate of change in temperature
(c)
Expert Solution
Answer to Problem 111AYU
Therefore the average rate of change in temperature is 0°F/h
Explanation of Solution
Calculation:
The change in temperature from 3 PM to 6 PM is as follows
63.0°F−63.0°F=0°F
Therefore the average rate of change in temperature is 0°F/h
Conclusion:
Therefore the average rate of change in temperature is 0°F/h
(d)
To determine
To decide: a function of best fit and predict the temperature at 5 PM.
(d)
Expert Solution
Answer to Problem 111AYU
The temperature at 5 PM is 63.044°F .
Explanation of Solution
Calculation:
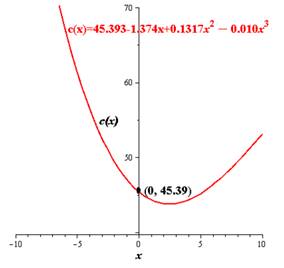
By observing the scatter diagram of the data it can be seen that the cubic function will model the relation between the variables. The cubic function obtained by the graphic utility is as follows
c(x)=45.393−1.374x+0.317x2−0.0103x3
To predict the temperature at 5 PM. substitute the value x=17 in c(x)
Need a deep-dive on the concept behind this application? Look no further. Learn more about this topic, calculus and related others by exploring similar questions and additional content below.
Probability & Statistics (28 of 62) Basic Definitions and Symbols Summarized; Author: Michel van Biezen;https://www.youtube.com/watch?v=21V9WBJLAL8;License: Standard YouTube License, CC-BY
Introduction to Probability, Basic Overview - Sample Space, & Tree Diagrams; Author: The Organic Chemistry Tutor;https://www.youtube.com/watch?v=SkidyDQuupA;License: Standard YouTube License, CC-BY


 Calculus: Early TranscendentalsCalculusISBN:9781285741550Author:James StewartPublisher:Cengage Learning
 Thomas' Calculus (14th Edition)CalculusISBN:9780134438986Author:Joel R. Hass, Christopher E. Heil, Maurice D. WeirPublisher:PEARSON
 Calculus: Early Transcendentals (3rd Edition)CalculusISBN:9780134763644Author:William L. Briggs, Lyle Cochran, Bernard Gillett, Eric SchulzPublisher:PEARSON
 Calculus: Early TranscendentalsCalculusISBN:9781319050740Author:Jon Rogawski, Colin Adams, Robert FranzosaPublisher:W. H. Freeman
 Calculus: Early Transcendental FunctionsCalculusISBN:9781337552516Author:Ron Larson, Bruce H. EdwardsPublisher:Cengage Learning