
How the long-run
Explanation of Solution
By using the aggregate demand and supply model, long-run economic growth can be shown by representing the outward shift in the curve. The short-run fluctuations are different from the long-run aspects. Thus, fluctuated output level can be shown above or below the potential output level.
For instance, the aggregate shown below is showing outward shift that represents economic growth.
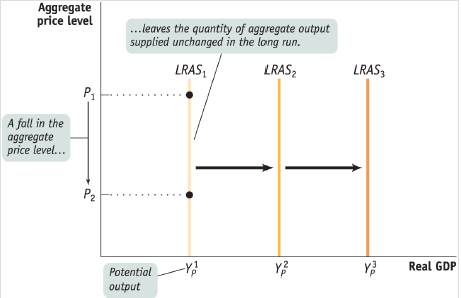
Graph 1
The short-run and long-run fluctuations can be shown as follows:
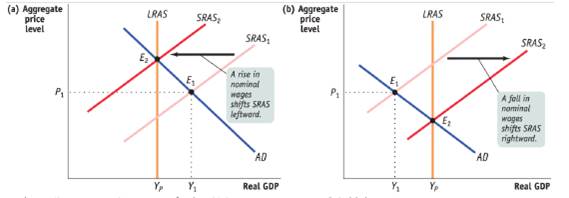
Graph 2
Production Possibilities Curve: The
Chapter 40 Solutions
Krugman's Economics For The Ap® Course


 Principles of Economics (12th Edition)EconomicsISBN:9780134078779Author:Karl E. Case, Ray C. Fair, Sharon E. OsterPublisher:PEARSON
 Engineering Economy (17th Edition)EconomicsISBN:9780134870069Author:William G. Sullivan, Elin M. Wicks, C. Patrick KoellingPublisher:PEARSON
 Principles of Economics (MindTap Course List)EconomicsISBN:9781305585126Author:N. Gregory MankiwPublisher:Cengage Learning
 Managerial Economics: A Problem Solving ApproachEconomicsISBN:9781337106665Author:Luke M. Froeb, Brian T. McCann, Michael R. Ward, Mike ShorPublisher:Cengage Learning
 Managerial Economics & Business Strategy (Mcgraw-...EconomicsISBN:9781259290619Author:Michael Baye, Jeff PrincePublisher:McGraw-Hill Education