
Loose Leaf for Financial Accounting: Information for Decisions
9th Edition
ISBN: 9781260158762
Author: John J Wild
Publisher: McGraw-Hill Education
expand_more
expand_more
format_list_bulleted
Videos
Textbook Question
Chapter 4, Problem 2FSA
comparative figures for Apple and Google follow.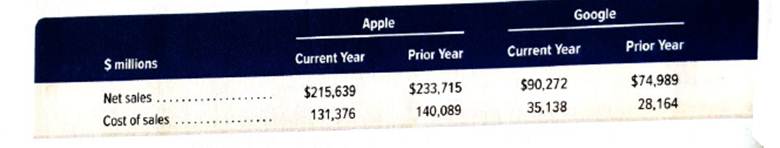
Required
1. Compute the amount of gross margin and the gross margin ratio for the two years shown for each ofthese companies.
2. Which company earns more in gross margin for each dollar of net sales for the current year?
3. Do (a) Apple’s and (b) Google’s current-year gross margins underperform or outperform the Industry(assumed) average of 35.0%?
4. Are (a) Apple’s and (b) Google’s current-year gross margins on a favorable or unfavorable trend?
Expert Solution & Answer
Want to see the full answer?
Check out a sample textbook solution
Students have asked these similar questions
Top executive officers of Tildon Company, a merchandising firm, are preparing the next year's budget. The controller has provided
everyone with the current year's projected income statement.
Current Year
$1,600,000
1,120,000
480,000
190,000
Sales revenue
Cost of goods sold
Gross profit
Selling & administrative expenses
Net income
290,000
Cost of goods sold is usually 70 percent of sales revenue, and selling and administrative expenses are usually 10 percent of sales plus
a fixed cost of $30,000. The president has announced that the company's goal is to increase net income by 15 percent.
Required
The following items are independent of each other:
a. Prepare a pro forma income statement. What percentage increase in sales would enable the company to reach its goal?
b. The market may become stagnant next year, and the company does not expect an increase in sales revenue. The production
manager believes that an improved production procedure can cut cost of goods sold by 2 percent. Prepare a…
(This is what is in between the 1st and 2nd screenshot)
Using these data, determine the following:
Earnings per share. Round your answer to two decimal places.
Price-to-earnings ratio. Round your answer to two decimal places.
Book value per share. Round your answer to two decimal places.
Market-to-book ratio. Round your answer to two decimal places.
EV-EBITDA multiple. Assume the cost of sales includes $14 million in depreciation expenses. Assume there are no amortization expenses. Round your answer to two decimal places.
How much of the retained earnings total was added during Year 1? Enter your answer in millions. For example, an answer of $1.2 million should be entered as 1.2, not 1,200,000. Round your answer to two decimal places.$ million
Show Eastland’s new balance sheet after the company sells 1 million new common shares in early Year 2 to net $28 a share. Part of the proceeds, $12 million, is used to reduce current liabilities, and the remainder is temporarily…
The gross profit margin indicates how profitable sales have been.
Q.1 Calculate the gross profit margin for Pearson & Litt for 2020.Q.2 Explain the results of the gross profit margin calculation.
Chapter 4 Solutions
Loose Leaf for Financial Accounting: Information for Decisions
Ch. 4 - Prob. 1DQCh. 4 - In comparing the accounts of a merchandising...Ch. 4 - Prob. 3DQCh. 4 - Prob. 4DQCh. 4 - How does a company that uses a perpetual inventory...Ch. 4 - Distinguish between cash discounts and trade...Ch. 4 - What is the difference between a sales discount...Ch. 4 - Prob. 8DQCh. 4 - Prob. 9DQCh. 4 - Prob. 10DQ
Ch. 4 - Prob. 11DQCh. 4 - Prob. 12DQCh. 4 - Refer to the income statement for Samsung in...Ch. 4 - Refer to the income statement of Samsung in...Ch. 4 - Buyers negotiate purchase contracts with...Ch. 4 - Enter the letter for each term in the blank space...Ch. 4 - Prob. 2QSCh. 4 - Use the following information (in random order)...Ch. 4 - Compute the amount to be paid for each of the four...Ch. 4 - Prepare journal entries to record each of the...Ch. 4 - Prob. 6QSCh. 4 - Prepare journal entries to record each of the...Ch. 4 - Prob. 8QSCh. 4 - Prob. 9QSCh. 4 - Prob. 10QSCh. 4 - Prob. 11QSCh. 4 - Prob. 12QSCh. 4 - Prob. 13QSCh. 4 - Prob. 14QSCh. 4 - Prob. 15QSCh. 4 - Prob. 16QSCh. 4 - Prob. 17QSCh. 4 - Prob. 18QSCh. 4 - Prob. 19QSCh. 4 - Prob. 21QSCh. 4 - Prob. 22QSCh. 4 - Prob. 24QSCh. 4 - Prob. 1ECh. 4 - Prob. 2ECh. 4 - Prob. 3ECh. 4 - Prob. 4ECh. 4 - Prob. 5ECh. 4 - Prob. 6ECh. 4 - Prob. 7ECh. 4 - Prob. 8ECh. 4 - Prob. 9ECh. 4 - Prob. 10ECh. 4 - Prob. 11ECh. 4 - A retailer completed a physical count of ending...Ch. 4 - Prob. 13ECh. 4 - Prob. 14ECh. 4 - Prob. 15ECh. 4 - Prob. 16ECh. 4 - Prob. 17ECh. 4 - Prob. 18ECh. 4 - Prob. 19ECh. 4 - Prob. 20ECh. 4 - Prob. 21ECh. 4 - Lopez Company reports unadjusted first-year...Ch. 4 - Prob. 23ECh. 4 - Piere Imports uses the perpetual system in...Ch. 4 - Prob. 25ECh. 4 - Prob. 1PSACh. 4 - Prepare journal entries to record the following...Ch. 4 - Prob. 3PSACh. 4 - Prob. 4PSACh. 4 - Prob. 1PSBCh. 4 - Prepare journal entries to record the following...Ch. 4 - Prob. 3PSBCh. 4 - Prob. 4PSBCh. 4 - Prob. 5PSBCh. 4 - Prob. 1GLPCh. 4 - The General Ledger tool in Connect automates...Ch. 4 - Prob. 3GLPCh. 4 - comparative figures for Apple and Google follow....Ch. 4 - Prob. 3FSACh. 4 - Amy Martin is a student who plans to attend...Ch. 4 - You are the financial officer for Music Plus, a...Ch. 4 - OfficialBrands’s general ledger and supplementary...Ch. 4 - Prob. 5BTN
Knowledge Booster


Learn more about
Need a deep-dive on the concept behind this application? Look no further. Learn more about this topic, accounting and related others by exploring similar questions and additional content below.Similar questions
- An analyst is evaluating the profi tability of Daimler AG (Xetra: DAI) over a recentfi ve-year period. He gathers the following revenue data and calculates the followingprofi tability ratios from information in Daimler’s annual reports:2009 2008 2007 2006 2005Revenues (€ millions) 78,924 98,469 101,569 99,222 95,209Gross profi t margin 16.92% 21.89% 23.62% 20.60% 19.48%Operating profi t (EBIT) margin a–1.92% 2.77% 8.58% 5.03% 3.02%Pretax margin –2.91% 2.84% 9.04% 4.94% 2.55%Net profi t margin –3.35% 1.73% 4.78% 3.19% 2.37%aEBIT (Earnings before interest and taxes) is the operating profi t metric used by Daimler.Daimler’s revenue declined from 2007 to 2008 and from 2008 to 2009. Further,Daimler’s 2009 revenues were the lowest of the fi ve years. Management’s discussion ofthe decline in revenue and EBIT in the 2009 Annual Report notes the following:Th e main reason for the decline [in EBIT] was a signifi cant drop in revenuedue to markedly lower unit sales in all vehicle segments as a…arrow_forwardRefer again to the income statements for Cover-to-Cover Company and Biblio Files Company on their respective Income Statement panels. Note that both companies have the same sales and net income. Answer questions (1) - (3) that follow, assuming that all data for the coming year is the same as the current year, except for the amount of sales. 1. If Cover-to-Cover Company wants to increase its profit by $20,000 in the coming year, what must their amount of sales be? 2. If Biblio Files Company wants to increase its profit by $20,000 in the coming year, what must their amount of sales be? 3. What would explain the difference between your answers for (1) and (2)? The answers are not different; each company has the same required sales amount for the coming year to achieve the desired target profit. The companies have goals that are not in the relevant range. Biblio Files Company has a higher contribution margin ratio, and so more of each sales dollar is…arrow_forwardQ1) You are required to calculate the Relative Percentage Change in the company for the blanks below and the Net Profit for the other blanks. Show all working out below including the formula used for each year and include the completed table here. Year 2010 2011 2012 2013 2014 2015 2016 2017 2018 2019 Net Profit ($ 000’) <blank> 50 200 150 225 250 <blank> 200 250 260 Relative Percentage Change N/A -50% 300% <blank> 50% 11% -30% 14% 25% <blank> Table 1: Net Profit ($) per financial year Q1 a) Using Excel, create a column chart of the Net Profit calculated in part (a) for the years 2010-2019. label the axis and provide an appropriate title. Q1 b) Using Excel, create a Sparkline of the Relative Percentage Change calculated in part (a) for the years 2011-2019. use the Sparkline options to mark if there are any negative values and include a horizontal axis to easily visualise…arrow_forward
- Target Profit Refer again to the income statements for Cover-to-Cover Company and Biblio Files Company on their respective Income Statement. Note that both companies have the same sales and net income. Answer questions (1) - (3) that follow, assuming that all data for the coming year is the same as the current year, except for the amount of sales. 1. If Cover-to-Cover Company wants to increase its profit by $30,000 in the coming year, what must their amount of sales be?$fill in the blank 76bbeef61075022_1 2. If Biblio Files Company wants to increase its profit by $30,000 in the coming year, what must their amount of sales be?$fill in the blank 76bbeef61075022_2 3. What would explain the difference between your answers for (1) and (2)? a. Biblio Files Company has a higher contribution margin ratio, and so more of each sales dollar is available to cover fixed costs and provide operating income. b. Cover-to-Cover Company’s contribution margin ratio is lower, meaning that it’s more…arrow_forwardCommon-size financial statements. Prepare common-size income statements for Walmart and Starbucks using the January 2015 and September 2014 information in the popup window: Which company is doing a better job of getting sales dollars to net income? Where is the one company having an advantage over the other company in turning revenue into net income? Complete the table below. (Round to two decimal places. Net income to three decimal places.) Abbreviated Income Statements ($ in Millions) Company Account Walmart, Inc. 1/31/2015 Starbucks 9/30/2014 Sales 491,920 % 16,801 % Cost of goods sold $ -370,530 % 7,272 % Selling, general, and administrative expenses $ -94,693 % $ -11,569 % EBIT $ 26,697 % $ -2,040 % Interest expense S -2,343 % $ -26 % Taxes $ -9,011 % 764 % Net income $ 15,343 % -1,302 % Which company is doing a better job of getting sales dollars to net income? (Select from the drop-down menus.) Walmart and Starbucks bring and cents of sales revenue to the bottom line,…arrow_forwardTarget Profit Refer again to the income statements for Cover-to-Cover Company and Biblio Files Company on their respective Income Statement. Note that both companies have the same sales and net income. Answer questions (1) - (3) that follow, assuming that all data for the coming year is the same as the current year, except for the amount of sales. 1. If Cover-to-Cover Company wants to increase its profit by $20,000 in the coming year, what must their amount of sales be? $ 2. If Biblio Files Company wants to increase its profit by $20,000 in the coming year, what must their amount of sales be? $ Cover-to-Cover CompanyContribution Margin Income StatementFor the Year Ended December 31, 20Y8 Sales $409,000 Variable costs: Manufacturing expense $245,400 Selling expense 20,450 Administrative expense 61,350 (327,200) Contribution margin $81,800 Fixed costs: Manufacturing expense $5,000 Selling expense 4,000 Administrative expense…arrow_forward
- Using Table 6–13, create a pro forma balance sheet using the percentage of sales method. If net income next year is $50,000, answer the following: How much did the owners take out of the business? What is the profit margin for next year?arrow_forwardAttached is Apple Inc.'s financial information. Please answer questions 1-3. 1. Apple's earnings per share in 2021 is ___a. 2.74 b. 4.28 c. 3.42 d. 5.80 2. Apple's price-to-earnings ratio on 12/31/2021 is ____a. 49.29 b. 15.46 c. 23. 28 d. 30.61 3. Apple's working capital turnover in 2021 is___a. 17.27 b. 19.18 c. 14.82 d. 15.35arrow_forward1. The annual net income of MAC Industries since 2005 is given below. Years t (since 2005) Net Income 1 4 6 12 15 $1,500 $2,500 $2,875 $2,850 $2,250 a. Create a scatter plot that includes your curve of best fit on top of the data. You should try several functions and make your choice based on best r-squared value. b. Find the year that Net Income was at its highest point. c. What was the income in that year?arrow_forward
- Compare Delta to two of its competitors, JetBlue and Southwest, by answering the following questions. You do not need to calculate all of the ratios for JetBlue and Southwest, only the ones required to answer the questions below: How much bigger is Delta from each of its competitors, by Revenue, in each year from 2018-2022? Plot the Revenue number for each company for these years on a single line graph. Which company has the highest Net Income in each year from 2018-2022? Which company has the highest Net Profit Margin in 2018? In 2022? Which company is the most profitable based on Gross Profit percentage each year from 2018-2022? (This is a trick question.) Which company is best at using its short-term assets to pay off its short-term liabilities in 2019? Which company has the best cash ratio in 2019? Is it the same company that is best at using its short-term assets to pay short-term liabilities? If not, why do you think it's different? Which company is the most leveraged in 2022?arrow_forwardWhat is the comparison (analysis) of the Days Sales Outstanding of Industry Average Ratio and the Company A Ratio? The Days Sales Outstanding has decreased and increased. Why? Industry Average DSO 2015: 138 days 2016: 104 days 2017: 173 days 2018: 125 days 2019: 98 days Company A DSO 2015: 245 days 2016: 338 days 2017: 332 days 2018: 169 days 2019: 81 daysarrow_forwardLuxury Goods Group, an Italian company that sells sunglasses, reported net sales of €6.3 billion in 2018 and €7.3 billion in 2017. Gross profit decreased from €4.2 billion in 2017 to €3.5 billion in 2018. 1. Calculate the gross profit percentage for each year. (Round your answers to 1 decimal place.) 2. The change in gross profit was caused by: Complete this question by entering your answers in the tabs below. Required 1 Required 2 Calculate the gross profit percentage for each year. (Round your answers to 1 decimal place.) Gross Profit 2018 2017 %arrow_forward
arrow_back_ios
SEE MORE QUESTIONS
arrow_forward_ios
Recommended textbooks for you

How To Analyze an Income Statement; Author: Daniel Pronk;https://www.youtube.com/watch?v=uVHGgSXtQmE;License: Standard Youtube License