Tendon transfers People with spinal cord injuries may lose
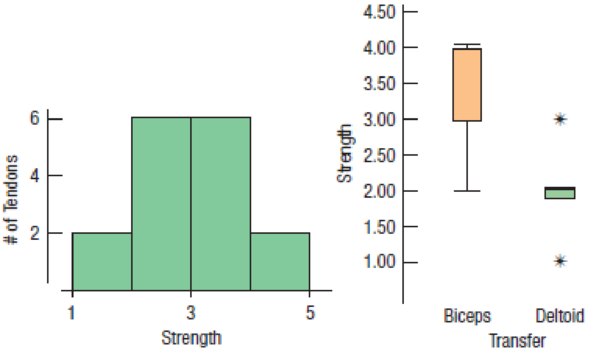
- a) Describe the shape of this distribution.
- b) What is the
range of the strength scores? - c) What fact about the results of the two procedures is hidden in the histogram?
- d) Which method had the higher (better)
median score? - e) Was that method always better?
- f) Which method produced more consistent results? Explain.
Want to see the full answer?
Check out a sample textbook solutionChapter 4 Solutions
Intro Stats
Additional Math Textbook Solutions
STATISTICS F/BUSINESS+ECONOMICS-TEXT
Elementary Statistics: Picturing the World (6th Edition)
Essentials of Statistics (6th Edition)
STATS:DATA+MODELS-W/DVD
Elementary Statistics: A Step By Step Approach
Statistics for Business and Economics (13th Edition)
- Recent research indicates that the effectiveness of antidepressant medication is directly related to the severity of the depression (Khan, Brodhead, Kolts & Brown, 2005). Based on pretreatment depression scores, patients were divided into four groups based on their level of depression. After receiving the antidepressant medication, depression scores were measured again and the amount of improvement was recorded for each patient. The following data are similar to the results of the study. (see image #1) This is the summary table for the ANOVA test: S.S. d.f. M.S. Between 22.612239583333 3 7.5374131944444 Within 198.05895833333 188 1.0535050975177 TOTAL 220.67119791667 191 From this table, you obtain the necessary statistics for the ANOVA:F-ratio: 7.154605338127p-value: 0.00014η2=η2= 0.10247028065653What is your final conclusion? Use a significance level of α=0.01α=0.01. There is a significant difference between treatments These data do not provide evidence of a…arrow_forwardYou may need to use the appropriate technology to answer this question. An automobile dealer conducted a test to determine if the time in minutes needed to complete a minor engine tune-up depends on whether a computerized engine analyzer or an electronic analyzer is used. Because tune-up time varies among compact, intermediate, and full-sized cars, the three types of cars were used as blocks in the experiment. The data obtained follow. Analyzer computerized electronic Car compact 50 41 Intermediate 56 45 Full Sized 62 46 Use ? = 0.05 to test for any significant differences. State the null and alternative hypotheses. H0: ?Computerized = ?ElectronicHa: ?Computerized ≠ ?ElectronicH0: ?Computerized ≠ ?ElectronicHa: ?Computerized = ?Electronic H0: ?Computerized = ?Electronic = ?Compact = ?Intermediate = ?Full-sizedHa: Not all the population means are equal.H0: ?Compact = ?Intermediate = ?Full-sizedHa: ?Compact ≠ ?Intermediate ≠ ?Full-sizedH0:…arrow_forwardRecent research indicates that the effectiveness of antidepressant medication is directly related to the severity of the depression (Khan, Brodhead, Kolts & Brown, 2005). Based on pretreatment depression scores, patients were divided into four groups based on their level of depression. After receiving the antidepressant medication, depression scores were measured again and the amount of improvement was recorded for each patient. The following data are similar to the results of the study. LowModerate HighModerate ModeratelySevere Severe 0.5 2.7 3.4 2.6 1.7 0.8 2.6 5.3 3.3 1.9 1.1 4 2.6 1.4 4.3 2.6 1.4 2.9 3.6 4.6 3.1 3.2 4.8 1.4 From this table, conduct an one-way ANOVA. Calculate the F-ratio and p-value. Be sure to round your answers to three decimal places. Assume all population and ANOVA requirements are met.F-ratio: p-value:arrow_forward
- Recent research indicates that the effectiveness of antidepressant medication is directly related to the severity of the depression (Khan, Brodhead, Kolts & Brown, 2005). Based on pretreatment depression scores, patients were divided into four groups based on their level of depression. After receiving the antidepressant medication, depression scores were measured again and the amount of improvement was recorded for each patient. The following data are similar to the results of the study. LowModerate HighModerate ModeratelySevere Severe 2.4 0.2 2.5 3.5 1.6 1.7 2.7 4.3 2.7 3.4 2 3.4 0.5 1.2 5.2 5.1 2.4 2.3 4 3.5 1.8 0.3 4.1 3.8 From this table, conduct an one-way ANOVA. Calculate the F-ratio and p-value. Be sure to round your answers to three decimal places. Assume all population and ANOVA requirements are met.F-ratio: _____p-value: _____What is your final conclusion? Use a significance level of α=0.05. (Select one): There is sufficient evidence that…arrow_forwardRecent research indicates that the effectiveness of antidepressant medication is directly related to the severity of the depression (Khan, Brodhead, Kolts & Brown, 2005). Based on pretreatment depression scores, patients were divided into four groups based on their level of depression. After receiving the antidepressant medication, depression scores were measured again and the amount of improvement was recorded for each patient. The following data are similar to the results of the study. LowModerate HighModerate ModeratelySevere Severe 0.3 1.2 2.2 1.8 3.8 1.7 1.4 2.8 3.2 0.4 0.6 2.6 2.3 1.2 1.6 2.6 2 3.2 1.6 2.2 0.6 1.2 1.6 1 2.7 1 2.2 0.6 1.4 1.6 3.3 2.7 2.2 2.9 3.7 2.6 0.9 0.7 3.4 3.1 2.6 1.7 0.8 1.8 2 1.4 1.6 4.1 1.7 0.9 3.3 2.3 1.6 1.1 3.5 1.4 3.5 1.9 0.4 4.2 1.5 2.3 2.2 2.9 1.4 2.2 2.7 2.8 2.1 1.9 1.9 3.9 1.5 2.7 0.8 1.5 1 3 2.1 3.7 1.5 0.9 2.4 1.9 2.7 3.2 0.8 2.7 2.2 2.9 1.8 1.2 2.4 1.7 3.2 1.3 2.2 2.4 1.1 1 2.6 2…arrow_forwardRecent research indicates that the effectiveness of antidepressant medication is directly related to the severity of the depression (Khan, Brodhead, Kolts & Brown, 2005). Based on pretreatment depression scores, patients were divided into four groups based on their level of depression. After receiving the antidepressant medication, depression scores were measured again and the amount of improvement was recorded for each patient. The following data are similar to the results of the study. LowModerate HighModerate ModeratelySevere Severe 2.2 1.4 3.4 3.4 1.5 1.4 3.5 2.8 2.8 3.1 2.7 2.3 1.7 2.6 4.4 3.6 1.3 1.5 2.6 3.2 1.3 2.6 2.8 3.5 Fill in the summary table for the ANOVA test: degrees of freedom (d.f.) Sum of Squares (S.S.) Mean Square (M.S.) Between Within Total From this table, obtain the necessary statistics for the ANOVA:F-ratio (F-test statistic): p-value: η2η2 (Eta squared = Sum of squares betweenSum of squares totalSum…arrow_forward
- You may need to use the appropriate technology to answer this question. An automobile dealer conducted a test to determine if the time in minutes needed to complete a minor engine tune-up depends on whether a computerized engine analyzer or an electronic analyzer is used. Because tune-up time varies among compact, intermediate, and full-sized cars, the three types of cars were used as blocks in the experiment. The data obtained follow. Analyzer Computerized Electronic Compact 50 41 Car Intermediate 54 44 Full-sized 64 47 Use a = 0.05 to test for any significant differences. State the null and alternative hypotheses. O Ho: MCompact = "Intermediate = HFull-sized H: "Compact * "Intermediate * "Full-sized O Ho: "Compact * "Intermediate * HFull-sized H: "Compact "Intermediate = "Full-sized O Ho: Computerized = HElectronic H: "Computerized * HElectronic O Ho: "Computerized = HElectronic = "Compact = Intermediate = Full-sized H: Not all the population means are equal. O Ho: HComputerized *…arrow_forwardRecent research indicates that the effectiveness of antidepressant medication is directly related to the severity of the depression (Khan, Brodhead, Kolts & Brown, 2005). Based on pretreatment depression scores, patients were divided into four groups based on their level of depression. After receiving the antidepressant medication, depression scores were measured again and the amount of improvement was recorded for each patient. The following data are similar to the results of the study. Low Moderate High Moderate Moderately Severe Severe 1.6 2.9 3.8 3.4 0.9 1.3 3 2.8 1.8 3.1 3.3 3.2 2.7 3.7 2.4 4.9 3.8 2.9 3.7 3.2 4.9 1.7 From this table, conduct an one-way ANOVA. Calculate the F-ratio and p-value. Be sure to round your answers to three decimal places. Assume all population and ANOVA requirements are met. F-ratio: p-value: What is your final conclusion? Use a significance level of a = 0.01. O There is sufficient evidence that there exists a significant difference between treatments. O…arrow_forwardRecent research indicates that the effectiveness of antidepressant medication is directly related to the severity of the depression (Khan, Brodhead, Kolts & Brown, 2005). Based on pretreatment depression scores, patients were divided into four groups based on their level of depression. After receiving the antidepressant medication, depression scores were measured again and the amount of improvement was recorded for each patient. The following data are similar to the results of the study. Low High Moderate Moderate Moderately Severe Severe 0 2.6 2.7 2.7 1.7 2.5 3.2 3.3 2.2 3 3.2 5.2 0.6 1.8 3.8 1.5 1.9 1.9 3.8 5.9 1.3 1.2 2.4 2.9 From this table, conduct an one-way ANOVA. Calculate the F-ratio and p-value. Be sure to round your answers to three decimal places. Assume all population and ANOVA requirements are met. F-ratio: p-value: What is your final conclusion? Use a significance level of απ 0.02. There is not enough evidence to determine a difference between the treatments. There is…arrow_forward
- Recent research indicates that the effectiveness of antidepressant medication is directly related to the severity of the depression (Khan, Brodhead, Kolts & Brown, 2005). Based on pretreatment depression scores, patients were divided into four groups based on their level of depression. After receiving the antidepressant medication, depression scores were measured again and the amount of improvement was recorded for each patient. The following data are similar to the results of the study. Low High Moderate Moderately Moderate Severe Severe 3.1 1.3 5.1 3.5 2.3 3.3 3.6 2.9 2.7 2.9 1.8 4.2 3 4 4.2 2 3.9 3.9 4.7 2.1 0.5 2.5 2.2 From this table, conduct an one-way ANOVA. Calculate the F-ratio and p-value. Be sure to round your answers to three decimal places. Assume all population and ANOVA requirements are met. F-ratio: p-value: What is your final conclusion? Use a significance level of a = 0.02. O There is not enough evidence to determine a difference between the treatments. O There is…arrow_forwardA report suggests that business majors spend the least amount of time on course work than other college students (The New York Times, November 17, 2011), A provost of a university conducts a survey of 50 business and 50 nonbusiness students. Students are asked if they study hard, defined as spending at least 20 hours per week on course work. The response shows "yes" if they worked hard or "no" otherwise; a portion of the data is shown in the following table. Business Majors Nonbusiness Majors Yes No No Yes No Yes Yes Yes At the 5% level of significance, determine if the percentage of business majors who study hard is less than 20%? At the 5% level of significance, determine if the percentage of nonbusiness majors who study hard is more than 20%.arrow_forwardRecent research indicates that the effectiveness of antidepressant medication is directly related to the severity of the depression (Khan, Brodhead, Kolts & Brown, 2005). Based on pretreatment depression scores, patients were divided into four groups based on their level of depression. After receiving the antidepressant medication, depression scores were measured again and the amount of improvement was recorded for each patient. The following data are similar to the results of the study. F-ratio: Low Moderate p-value: 2.2 3.1 0.6 2.6 0.5 0 High Moderate 1.5 2.1 3.3 2.3 2.1 4.6 Moderately Severe 2.7 4.7 4.7 4.6 3.7 3.3 From this table, conduct ANOVA. Calculate the F-ratio and p-value. Be sure to round your answers to three decimal places. Severe 3.8 2.4 5.3 4.7 4.2 4 What is your final conclusion? Use a significance level of a = 0.02. O There is sufficient evidence that there exists a significant difference between treatments. O There is not enough evidence to determine a difference…arrow_forward
- Linear Algebra: A Modern IntroductionAlgebraISBN:9781285463247Author:David PoolePublisher:Cengage LearningFunctions and Change: A Modeling Approach to Coll...AlgebraISBN:9781337111348Author:Bruce Crauder, Benny Evans, Alan NoellPublisher:Cengage LearningGlencoe Algebra 1, Student Edition, 9780079039897...AlgebraISBN:9780079039897Author:CarterPublisher:McGraw Hill
- Big Ideas Math A Bridge To Success Algebra 1: Stu...AlgebraISBN:9781680331141Author:HOUGHTON MIFFLIN HARCOURTPublisher:Houghton Mifflin Harcourt