Graphical representation of reduction in employment at minimum wage rate.
Explanation of Solution
The reduction in employment when the wage rate is set above the equilibrium is illustrated below:
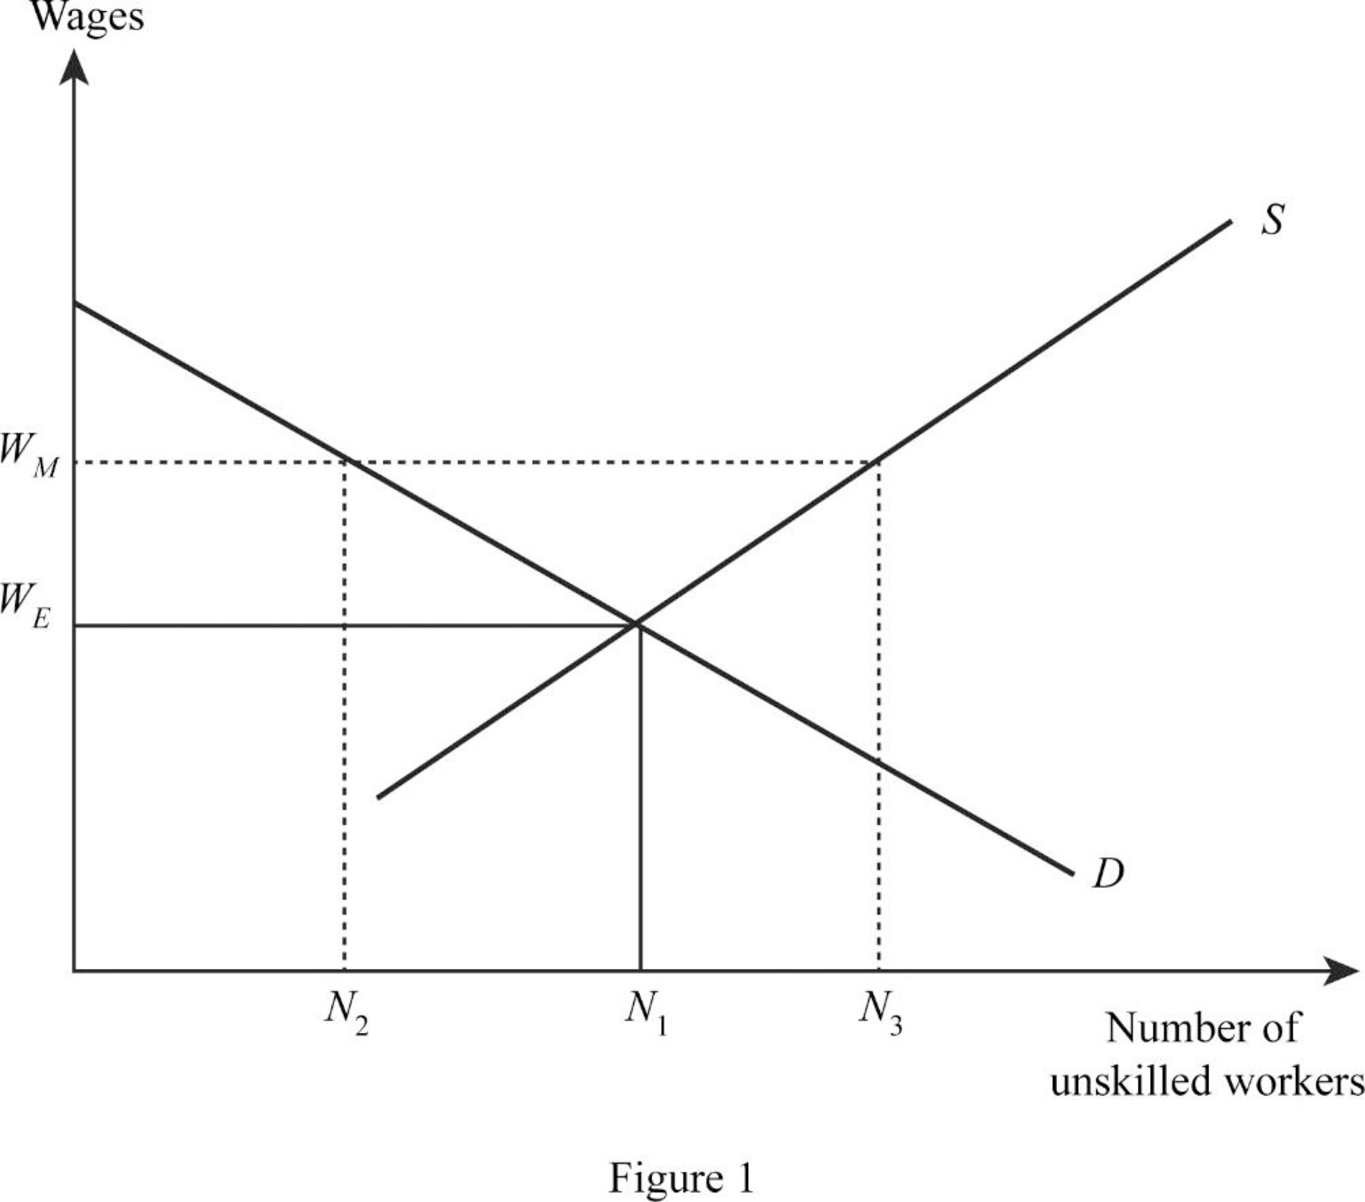
In Figure 1, the horizontal axis represents the number of skilled labor and the vertical axis represents the wage rate. The equilibrium wage rate is at WE, where the
Demand for labor: Demand for labor is defined as the quantity of labor demanded by the firms at different wage rates.
Supply of labor: Supply of labor refers tp the quantity of labor ready to work at the given wage rate.
Want to see more full solutions like this?
Chapter 4 Solutions
Macroeconomics (Book Only)

- Calculate the effects on the equilibrium price and quantity of a 100 percent increase in the wage rate.Show the necessary solutions.arrow_forwarddraw a graph with this difinitions To visualize the impact of the minimum wage on the labor market, I have created an original graph (see below). This graph depicts a hypothetical labor market before and after an increase in the minimum wage. [Please insert your original graph here.] In the graph, the x-axis represents the quantity of labor, and the y-axis represents the wage rate. The blue curve (labeled "Initial Equilibrium") represents the initial labor market equilibrium, where the supply of labor (S) intersects with the demand for labor (D) at point A, determining the initial wage rate and employment level. The red curve (labeled "After Minimum Wage Increase") illustrates the impact of a minimum wage hike. When the government imposes a higher minimum wage, it acts as a price floor (represented by the horizontal line). This results in a new equilibrium at point B, where the wage rate is higher, but employment is lower compared to the initial equilibrium.arrow_forwardSummarize the evidence regarding the impact of the minimum wage on employment.arrow_forward
- true or false? The entrance of more workers into a particular labor market is likely to drive down the wage in that marketarrow_forwardIf the Firm operates in a Perfectly Competitive Labor Market where the going market wage is $12, what is the profit-maximizing level of employment?If the Firm operates in a Perfectly Competitive Labor Market where the going market wage is $12, what is the profit-maximizing level of employment?arrow_forwardWhich of the following would increase the demand for labor? There’s an increase in the number of workers The price of the output good increases The substitution effect makes leisure more expensive as wages increase Leisure is a normal good and the income effect occurs when wages changearrow_forward
- Draw a graph that shows when minimum wage is expected to result in little or no unemployment as long as the wage remains in the indeterminant range.arrow_forwardThe graph shows the market for apple pickers in New England. Question Viewer what is the equilibrium wage rate and the equilibrium quantity of pickers employed? If the New England states introduce a minimum wage of $7.00 an hour, how many apple pickers are employed and how many are unemployed? The equilibrium wage rate of apple pickers is $10.50 an hour and the equilibrium quantity of apple pickers employed is 7000. If the New England states introduce a minimum wage of $7.00 an hour, pickers are employed and pickers are unemployed. 17.50- 14.00- 10.50- 7.00- 3.50+ Wage rate (dollars per hour) 3500 5250 7000 Quantity (pickers) 8750 S D 10500 Uarrow_forward1. Computing labor productivity and its relationship to the demandfor labor Sizzler's produces charcoal grills in a small manufacturing facility and sells the grills in a competitive market. The following table presents the company's production function: Labor (Number of workers) 0 OUTPUT (Grills) 400 360 320 280 Use the blue points (circle symbol) to plot the production function for Sizzler's on the following graph. 240 200 160 120 80 40 0 1 0 2 3 4 5 1 Output (Grills) 0 95 185 260 320 355 2 3 LABOR (Number of workers) 4 5 Production Function (?) Calculate the marginal product of labor (MPL) of each worker, and then plot the MPL curve on the following graph using the blue points (circle symbol).arrow_forward
- The graph above shows a labor market where the downward-sloping curve is firm demand for labor and the upward-sloping curve is the worker supply curve. The vertical axis shows the hourly wage and the horizontal axis shows the number of full-time workers. Suppose a minimum wage of $9 is instituted. How many unemployed workers will result from the minimum wage? (Note: An unemployed worker is anyone who wants to work but cannot find a job.)arrow_forwardTed’s café hires workers to produce lattes. The market for lattes is competitive and the price of a latte is $4. The labor market is also competitive, and the wage rate is $40 a day. The table shows the workers’ total product schedule. If Ted’s Cafe is one of 300 firms in the latte market, how many workers will be employed in the market at this price? Ted’s Café installs a new latte equipment that increases the productivity of workers by 50%. If the price of a latte remains at $4 and the wage rises to $48 a day, how many workers does Ted Café hire and why?arrow_forwardConsider the labor market for webpage designers illustrated in the graph to the right. What is the equilibrium wage? per hour. (Enter a numeric responses using an integer.) Suppose fewer firms demand webpages. Use the line drawing tool to draw either a new labor supply curve or a new labor demand curve that shows how this affects the labor market for webpage designers. Carefully follow the instructions above, and only draw the required objects. As a result of this change, the equilibrium wage increases decreases Wage (dollars per hour) 300- 275- 250- 225- 200- 175- 150- 125- 100- 75- 50- 25- Market for webpage designers Labor supply₁ X Labor demand₁ 20 40 80 100 120 140 60 Quantity of labor Q Ly ✪arrow_forward
 Essentials of Economics (MindTap Course List)EconomicsISBN:9781337091992Author:N. Gregory MankiwPublisher:Cengage Learning
 Brief Principles of Macroeconomics (MindTap Cours...EconomicsISBN:9781337091985Author:N. Gregory MankiwPublisher:Cengage Learning


