
Elementary Statistics: Picturing the World (7th Edition)
7th Edition
ISBN: 9780134683416
Author: Ron Larson, Betsy Farber
Publisher: PEARSON
expand_more
expand_more
format_list_bulleted
Concept explainers
Videos
Textbook Question
Chapter 4, Problem 1T
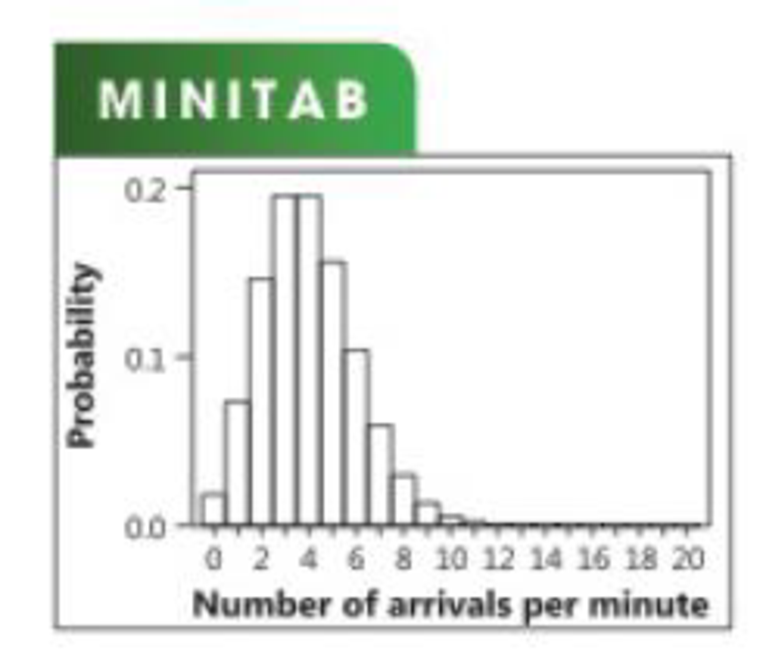
In Exercises 1–7, consider a grocery store that can process a total of four customers at its checkout counters each minute.
1. The
Expert Solution & Answer
Want to see the full answer?
Check out a sample textbook solution
Students have asked these similar questions
A researcher believes that the so-called “sugar high” is not real. He gathered 30 adolescents and recorded their activity level in the scale of 0 – 100 (0 = not active and 100 = super active). First, he recorded participants’ activity level before they consumed candy. After recording their pre-sugar activity level, the researcher gave out 5 Snickers bars to participants. Then, he recorded their post-sugar activity level. The average difference between post-sugar and pre-sugar activity level is 50 (i.e., the activity levels are higher after sugar than prior to it) with a standard deviation of 10.
A). Complete test statistic and critical values
B). Conclusion
A researcher believes that the so-called “sugar high” is not real. He gathered 30 adolescents and recorded their activity level in the scale of 0 – 100 (0 = not active and 100 = super active). First, he recorded participants’ activity level before they consumed candy. After recording their pre-sugar activity level, the researcher gave out 5 Snickers bars to participants. Then, he recorded their post-sugar activity level. The average difference between post-sugar and pre-sugar activity level is 50 (i.e., the activity levels are higher after sugar than prior to it) with a standard deviation of 10.
A). What is the type of test you will use? (z-test, single-sample t-test, paired-samples t-test, or independent samples t-test) and why (what information provided in the problem)B). What are the hypotheses (Be Specific)
3. Find the percentage of data points that lie between z1
picture to support your
= -3.01 and z2 = 2.61. Draw a
work.
Chapter 4 Solutions
Elementary Statistics: Picturing the World (7th Edition)
Ch. 4.1 - Determine whether each random variable x is...Ch. 4.1 - A company tracks the number of sales new employees...Ch. 4.1 - Verify that the distribution you constructed in...Ch. 4.1 - Determine whether each distribution is a...Ch. 4.1 - Find the mean of the probability distribution you...Ch. 4.1 - Find the variance and standard deviation of the...Ch. 4.1 - At a raffle, 2000 tickets are sold at 5 each for...Ch. 4.1 - What is a random variable? Give an example of a...Ch. 4.1 - What is a discrete probability distribution? What...Ch. 4.1 - Is the expected value of the probability...
Ch. 4.1 - What does the mean of a probability distribution...Ch. 4.1 - True or False? In Exercises 58, determine whether...Ch. 4.1 - True or False? In Exercises 58, determine whether...Ch. 4.1 - True or False? In Exercises 58, determine whether...Ch. 4.1 - True or False? In Exercises 58, determine whether...Ch. 4.1 - Graphical Analysis In Exercises 912, determine...Ch. 4.1 - Graphical Analysis In Exercises 912, determine...Ch. 4.1 - Graphical Analysis In Exercises 912, determine...Ch. 4.1 - Graphical Analysis In Exercises 912, determine...Ch. 4.1 - Discrete Variables and Continuous Variables In...Ch. 4.1 - Discrete Variables and Continuous Variables In...Ch. 4.1 - Discrete Variables and Continuous Variables In...Ch. 4.1 - Discrete Variables and Continuous Variables In...Ch. 4.1 - Discrete Variables and Continuous Variables In...Ch. 4.1 - Discrete Variables and Continuous Variables In...Ch. 4.1 - Constructing and Graphing Discrete Probability...Ch. 4.1 - Constructing and Graphing Discrete Probability...Ch. 4.1 - Finding Probabilities Use the probability...Ch. 4.1 - Finding Probabilities Use the probability...Ch. 4.1 - Unusual Events In Exercise 19, would it be unusual...Ch. 4.1 - Unusual Events In Exercise 20, would it be unusual...Ch. 4.1 - Determining a Missing Probability In Exercises 25...Ch. 4.1 - Determining a Missing Probability In Exercises 25...Ch. 4.1 - Identifying Probability Distributions In Exercises...Ch. 4.1 - Identifying Probability Distributions In Exercises...Ch. 4.1 - Finding the Mean, Variance, and Standard Deviation...Ch. 4.1 - Baseball The number of games played in each World...Ch. 4.1 - Finding the Mean, Variance, and Standard Deviation...Ch. 4.1 - Finding the Mean, Variance, and Standard Deviation...Ch. 4.1 - Hurricanes The histogram shows the distribution of...Ch. 4.1 - Reviewer Ratings The histogram shows the reviewer...Ch. 4.1 - Writing The expected value of an accountants...Ch. 4.1 - Writing In a game of chance, what is the...Ch. 4.1 - Finding an Expected Value In Exercises 37and 38,...Ch. 4.1 - A high school basketball team is selling 10 raffle...Ch. 4.1 - Linear Transformation of a Random Variable In...Ch. 4.1 - Prob. 40ECh. 4.1 - What is the average sum of their scores? What is...Ch. 4.1 - What is the standard deviation of the difference...Ch. 4.2 - Determine whether the experiment is a binomial...Ch. 4.2 - A card is selected from a standard deck and...Ch. 4.2 - A survey found that 52% of U.S. adults associate...Ch. 4.2 - The survey in Example 5 found that 27% of U.S....Ch. 4.2 - About 5% of workers (ages 16 years and older) in...Ch. 4.2 - A recent study found that 28% of U.S. adults read...Ch. 4.2 - In San Francisco, California, about 44% of the...Ch. 4.2 - In a binomial experiment, what does it mean to say...Ch. 4.2 - In a binomial experiment with n trials, what does...Ch. 4.2 - Graphical Analysis In Exercises 35, the histogram...Ch. 4.2 - Graphical Analysis In Exercises 35, the histogram...Ch. 4.2 - Graphical Analysis In Exercises 35, the histogram...Ch. 4.2 - Graphical Analysis In Exercises 68, the histogram...Ch. 4.2 - Graphical Analysis In Exercises 68, the histogram...Ch. 4.2 - Graphical Analysis In Exercises 68, the histogram...Ch. 4.2 - Identify the unusual values of x in each histogram...Ch. 4.2 - Identify the unusual values of x in each histogram...Ch. 4.2 - Mean, Variance, and Standard Deviation In...Ch. 4.2 - Mean, Variance, and Standard Deviation In...Ch. 4.2 - Mean, Variance, and Standard Deviation In...Ch. 4.2 - Mean, Variance, and Standard Deviation In...Ch. 4.2 - Identifying and Understanding Binomial Experiments...Ch. 4.2 - Identifying and Understanding Binomial Experiments...Ch. 4.2 - Identifying and Understanding Binomial Experiments...Ch. 4.2 - Identifying and Understanding Binomial Experiments...Ch. 4.2 - Finding Binomial Probabilities In Exercises 1926,...Ch. 4.2 - Finding Binomial Probabilities In Exercises 1926,...Ch. 4.2 - Finding Binomial Probabilities In Exercises 1926,...Ch. 4.2 - Finding Binomial Probabilities In Exercises 1926,...Ch. 4.2 - Finding Binomial Probabilities In Exercises 1926,...Ch. 4.2 - Finding Binomial Probabilities In Exercises 1926,...Ch. 4.2 - Finding Binomial Probabilities In Exercises 1926,...Ch. 4.2 - Finding Binomial Probabilities In Exercises 1926,...Ch. 4.2 - Constructing and Graphing Binomial Distributions...Ch. 4.2 - Constructing and Graphing Binomial Distributions...Ch. 4.2 - Constructing and Graphing Binomial Distributions...Ch. 4.2 - Constructing and Graphing Binomial Distributions...Ch. 4.2 - Finding and Interpreting Mean, Variance, and...Ch. 4.2 - Finding and Interpreting Mean, Variance, and...Ch. 4.2 - Finding and Interpreting Mean, Variance, and...Ch. 4.2 - Finding and Interpreting Mean, Variance, and...Ch. 4.2 - Finding and Interpreting Mean, Variance, and...Ch. 4.2 - Finding and Interpreting Mean, Variance, and...Ch. 4.2 - Genetics According to a theory in genetics, when...Ch. 4.2 - Genetics Another proposed theory in genetics gives...Ch. 4.2 - Manufacturing An assembly line produces 10,000...Ch. 4.2 - Prob. 1ACh. 4.2 - Prob. 2ACh. 4.2 - For the election in Exercise 1, simulate selecting...Ch. 4.2 - 1. Construct a probability distribution for the...Ch. 4.2 - 2. Construct binomial probability distributions...Ch. 4.2 - 3. Compare your distributions from Exercise 1 and...Ch. 4.2 - 4. During the 2016 regular season, Kris Bryant of...Ch. 4.3 - The study in Example 1 found that the smartphones...Ch. 4.3 - What is the probability that more than four...Ch. 4.3 - Two thousand brown trout are introduced into a...Ch. 4.3 - In Exercises 14, find the indicated probability...Ch. 4.3 - Prob. 2ECh. 4.3 - In Exercises 14, find the indicated probability...Ch. 4.3 - Prob. 4ECh. 4.3 - In Exercises 58, find the indicated probability...Ch. 4.3 - Prob. 6ECh. 4.3 - In Exercises 58, find the indicated probability...Ch. 4.3 - In Exercises 58, find the indicated probability...Ch. 4.3 - Prob. 9ECh. 4.3 - In your own words, describe the difference between...Ch. 4.3 - Prob. 11ECh. 4.3 - Using a Distribution to Find Probabilities In...Ch. 4.3 - Using a Distribution to Find Probabilities In...Ch. 4.3 - Using a Distribution to Find Probabilities In...Ch. 4.3 - Using a Distribution to Find Probabilities In...Ch. 4.3 - Using a Distribution to Find Probabilities In...Ch. 4.3 - Using a Distribution to Find Probabilities In...Ch. 4.3 - Using a Distribution to Find Probabilities In...Ch. 4.3 - Using a Distribution to Find Probabilities In...Ch. 4.3 - Using a Distribution to Find Probabilities In...Ch. 4.3 - Using a Distribution to Find Probabilities In...Ch. 4.3 - Using a Distribution to Find Probabilities In...Ch. 4.3 - Using a Distribution to Find Probabilities In...Ch. 4.3 - Using a Distribution to Find Probabilities In...Ch. 4.3 - Using a Distribution to Find Probabilities In...Ch. 4.3 - Using a Distribution to Find Probabilities In...Ch. 4.3 - Comparing Binomial and Poisson Distributions An...Ch. 4.3 - Hypergeometric Distribution Binomial experiments...Ch. 4.3 - Geometric Distribution: Mean and Variance In...Ch. 4.3 - Geometric Distribution: Mean and Variance In...Ch. 4.3 - Prob. 31ECh. 4.3 - Geometric Distribution: Mean and Variance In...Ch. 4 - In Exercises 13, assume the fire department...Ch. 4 - In Exercises 13, assume the fire department...Ch. 4 - In Exercises 13, assume the fire department...Ch. 4 - In Exercises 1 and 2, determine whether the random...Ch. 4 - In Exercises 1 and 2, determine whether the random...Ch. 4 - In Exercises 3 and 4, (a) construct a probability...Ch. 4 - In Exercises 3 and 4, (a) construct a probability...Ch. 4 - In Exercises 5 and 6, determine whether the...Ch. 4 - In Exercises 5 and 6, determine whether the...Ch. 4 - In Exercises 7 and 8, (a) find the mean, variance,...Ch. 4 - In Exercises 7 and 8, (a) find the mean, variance,...Ch. 4 - In Exercises 9 and 10, find the expected net gain...Ch. 4 - In Exercises 9 and 10, find the expected net gain...Ch. 4 - In Exercises 11 and 12, determine whether the...Ch. 4 - In Exercises 11 and 12, determine whether the...Ch. 4 - In Exercises 1316, find the indicated binomial...Ch. 4 - In Exercises 1316, find the indicated binomial...Ch. 4 - In Exercises 1316, find the indicated binomial...Ch. 4 - In Exercises 1316, find the indicated binomial...Ch. 4 - In Exercises 17 and 18, (a) construct a binomial...Ch. 4 - In Exercises 17 and 18, (a) construct a binomial...Ch. 4 - In Exercises 19 and 20, find the mean, variance,...Ch. 4 - In Exercises 19 and 20, find the mean, variance,...Ch. 4 - In Exercises 2126, find the indicated...Ch. 4 - Prob. 4.3.22RECh. 4 - In Exercises 2126, find the indicated...Ch. 4 - Prob. 4.3.24RECh. 4 - Prob. 4.3.25RECh. 4 - In Exercises 2126, find the indicated...Ch. 4 - Determine whether the random variable x is...Ch. 4 - The table lists the number of wireless devices per...Ch. 4 - Prob. 3CQCh. 4 - The five-year success rate of kidney transplant...Ch. 4 - An online magazine finds that the mean number of...Ch. 4 - Basketball player Dwight Howard makes a free throw...Ch. 4 - Which event(s) in Exercise 6 can be considered...Ch. 4 - In Exercises 13find the indicated probabilities...Ch. 4 - In Exercises 13, find the indicated probabilities...Ch. 4 - In Exercises 13find the indicated probabilities...Ch. 4 - Determine whether the distribution is a...Ch. 4 - The table shows the ages of students in a freshman...Ch. 4 - Seventy-seven percent of U.S. college students pay...Ch. 4 - The Centers for Disease Control and Prevention...Ch. 4 - The Centers for Disease Control and Prevention...Ch. 4 - Suspicious Samples? A lab worker tells you that...Ch. 4 - In Exercises 17, consider a grocery store that can...Ch. 4 - In Exercises 17, consider a grocery store that can...Ch. 4 - Prob. 3TCh. 4 - Prob. 4TCh. 4 - Prob. 5TCh. 4 - In Exercises 17, consider a grocery store that can...Ch. 4 - In Exercises 17, consider a grocery store that can...
Knowledge Booster


Learn more about
Need a deep-dive on the concept behind this application? Look no further. Learn more about this topic, statistics and related others by exploring similar questions and additional content below.Similar questions
- The American Mineralogist (Oct. 2009) published a study of the evolution of uranium minerals in the Earth's crust. Researchers estimate that the trace amount of uraniun distribution ranging between 1 and 3 parts per million. Complete parts a through c. a. Find E(x) and interpret its value. Select the correct answer below and fill in the answer box to complete your choice. (Simplify your answer.) O A. E(X)= .This value gives the minimum parts per million of uranium for the collection of all reservoirs on the Earth. O B. E(X)= This value gives the maximum parts per million of uranium for the collection of all reservoirs on the Earth. O C. E(x) = 2 . This value gives the mean parts per million of uranium for the collection of all reservoirs on the Earth. O D. E(X)= . This value gives the mean parts per million of uranium in each reservoir on the Earth. b. Compute P(2arrow_forwardThe American Mineralogist (Oct. 2009) published a study of the evolution of uranium minerals in the Earth's crust. Researchers estimate that the trace amount of uranium x in reservoirs follows a uniform distribution ranging between 1 and 3 parts per million. Complete parts a through c. a. Find E(x) and interpret its value. Select the correct answer below and fill in the answer box to complete your choice. (Simplify your answer.) O A. E(X)= This value gives the minimum parts per million of uranium for the collection of all reservoirs on the Earth. O B. E(X)= This value gives the maximum parts per million of uranium for the collection of all reservoirs on the Earth. O C. E(x)= This value gives the mean parts per million of uranium for the collection of all reservoirs on the Earth. O D. E(X)= This value gives the mean parts per million of uranium in each reservoir on the Earth.arrow_forwardLet x represent the hemoglobin count (HC) in grams per 100 milliliters of whole blood. The distribution for HC is approximately normal with μ = 14 for healthy adult women. Suppose that a female patient has taken 12 laboratory blood samples in the last year. The HC data sent to her doctor is listed below. We would like to know if the data indicates this patient has significantly high HC compared to the population. 14,19,16,14,19,19,14,21,17,17,14,17 Give the p-value and interpret the results. a) p = 0.0012; Based on 5% significance level, I will reject the null hypothesis and conclude this patient has a high HC level. b) p = 0.0012; Based on 5% significance level, I will fail to reject the null hypothesis and conclude this patient does not have a high HC level. c) p = 0.0023; Based on 5% significance level, I will reject the null hypothesis and conclude this patient has a high HC level. d) p = .1053; Based on 5% significance level, I will fail to reject the null hypothesis and…arrow_forwardYou want to conduct a study on the proportion of Penn State students who miss class when it is raining. Suppose here is the data you collect for students who live on-campus versus students who live off-campus: Never Miss Sometimes Miss Always Miss On-Campus 20 12 13 Off-Campus 45 14 22 a. For on-campus students (only), estimate the true difference in proportions for those who never miss class versus those who always miss class, when it is raining. Place a bound on the error of estimation. b. Estimate the true difference between the proportions of on-campus students who always miss class versus the proportion of off-campus students who always miss class, when it is raining. Place a bound on the error of estimation.arrow_forwardRia wants to know if there is a specific difference between the average monthly hair growth using Shampoo A vs Shampoo B. She recruited 8 participants and compared their average monthly hair growth (in centimeters) using two different brands. Her data is assumed to be normally distributed which produced the following values:arrow_forwardSuppose that 95% of the bags of certain fertilizer mix weigh between 49 and 53 pounds. Averages of three succesive bags were plotted, and 47.5% of these were observed to lie between 51 and X pounds. Estimate the value of X. State assumptions you make and say whether these assumptions are likely to be true for this example.arrow_forwardFind the variance if X~N(0, 7) and 95% of the data are between -7 and 7.arrow_forwardLet x represent the hemoglobin count (HC) in grams per 100 milliliters of whole blood. The distribution for HC is approximately normal with μ = 14 for healthy adult women. Suppose that a female patient has taken 12 laboratory blood samples in the last year. The HC data sent to her doctor is listed below. We would like to know if the data indicates this patient has significantly high HC compared to the population. 20,17,15,15,22,21,16,16,20,22,15,21 Give the test statistic for this hypothesis test. Choose the correct answer from below options: a) z = 17.92 b) t = −5.17 c) t = 2.90 d) t = 5.17 e) z = −2.90 f) z = 5.17 g) t = −17.92arrow_forwardIn a Ni-Cd battery, a fully charged cell is composed of nickelic hydroxide. Nickel is an element that has multiple oxidation states. Assume the following proportions of the states: Nickel Charge Proportions Found 0 0.17 +2 0.34 +3 0.33 +4 0.5-0.34 Determine the mean of the nickel charge. Please enter the answer to 2 decimal places.arrow_forwardCalculate the variance of the set of data to two decimal places. Refer to the previous problem. Use σx to three decimal places if you use a calculator.arrow_forwarda sample of n=7 scores has the mean of M=16. One score in the population is changed from X=20 to X=5. What is the vaule of the new population mean?arrow_forward= 9. Assume that blood pressure readings are normally distributed with u = 124 and o = A researcher wishes to select people for a study but wants to exclude the top and bottom 8 percent. What would be the upper and lower readings to qualify people to participate in the study?arrow_forwardarrow_back_iosSEE MORE QUESTIONSarrow_forward_ios
Recommended textbooks for you
 Glencoe Algebra 1, Student Edition, 9780079039897...AlgebraISBN:9780079039897Author:CarterPublisher:McGraw Hill
Glencoe Algebra 1, Student Edition, 9780079039897...
Algebra
ISBN:9780079039897
Author:Carter
Publisher:McGraw Hill
Mod-01 Lec-01 Discrete probability distributions (Part 1); Author: nptelhrd;https://www.youtube.com/watch?v=6x1pL9Yov1k;License: Standard YouTube License, CC-BY
Discrete Probability Distributions; Author: Learn Something;https://www.youtube.com/watch?v=m9U4UelWLFs;License: Standard YouTube License, CC-BY
Probability Distribution Functions (PMF, PDF, CDF); Author: zedstatistics;https://www.youtube.com/watch?v=YXLVjCKVP7U;License: Standard YouTube License, CC-BY
Discrete Distributions: Binomial, Poisson and Hypergeometric | Statistics for Data Science; Author: Dr. Bharatendra Rai;https://www.youtube.com/watch?v=lHhyy4JMigg;License: Standard Youtube License