Concept explainers
Videos
Use Solver to create a Sensitivity Report for question 23 at the end of chapter 3 and answer the following questions:
- a. Is the optimal solution unique? How can you tell?
- b. Which location is receiving the fewest cars?
- c. Suppose a particular car at location 1 must be sent to location 3 in order to meet a customer’s request. How much does this increase costs for the company?
- d. Suppose location 6 must have at least eight cars shipped to it. What impact does this have on the optimal objective function value?
23. The Rent-A-Dent car rental company allows its customers to pick up a rental car at one location and return it to any of its locations. Currently, two locations (1 and 2) have 16 and 18 surplus cars, respectively, and four locations (3, 4, 5, and 6) each need 10 cars. The costs of getting the surplus cars from locations 1 and 2 to the other locations are summarized in the following table.
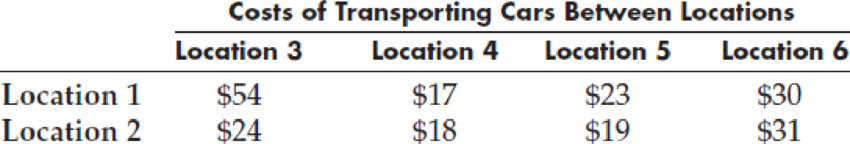
Because 34 surplus cars are available at locations 1 and 2, and 40 cars are needed at locations 3, 4, 5, and 6, some locations will not receive as many cars as they need. However, management wants to make sure that all the surplus cars are sent where they are needed, and that each location needing cars receives at least five.
- a. Formulate an LP model for this problem.
- b. Create a spreadsheet model for this problem and solve it using Solver.
- c. What is the optimal solution?

Trending nowThis is a popular solution!

Chapter 4 Solutions
Spreadsheet Modeling & Decision Analysis: A Practical Introduction to Business Analytics (MindTap Course List)


- Seas Beginning sells clothing by mail order. An important question is when to strike a customer from the companys mailing list. At present, the company strikes a customer from its mailing list if a customer fails to order from six consecutive catalogs. The company wants to know whether striking a customer from its list after a customer fails to order from four consecutive catalogs results in a higher profit per customer. The following data are available: If a customer placed an order the last time she received a catalog, then there is a 20% chance she will order from the next catalog. If a customer last placed an order one catalog ago, there is a 16% chance she will order from the next catalog she receives. If a customer last placed an order two catalogs ago, there is a 12% chance she will order from the next catalog she receives. If a customer last placed an order three catalogs ago, there is an 8% chance she will order from the next catalog she receives. If a customer last placed an order four catalogs ago, there is a 4% chance she will order from the next catalog she receives. If a customer last placed an order five catalogs ago, there is a 2% chance she will order from the next catalog she receives. It costs 2 to send a catalog, and the average profit per order is 30. Assume a customer has just placed an order. To maximize expected profit per customer, would Seas Beginning make more money canceling such a customer after six nonorders or four nonorders?arrow_forwardfertilizer manufacturer has to fulfill supply contracts to its two main customers (650 tons to Customer A and 800 tons to Customer B). It can meet this demand by shipping existing inventory from any of its three warehouses. Warehouse 1 (W1) has 400 tons of inventory onhand, Warehouse 2 (W2) has 500 tons, and Warehouse 3 (W3) has 600 tons. The company would like to arrange the shipping for the lowest cost possible, where the per-ton transit costs are as follows: W 1 W 2 W 3 Customer A $7.50 $6.25 $6.50 Customer B $6.75 $7.00 $8.00 Write the objective function and the constraint in equations. Let Vij= tons shipped to customer i from warehouse j, and so on. For example, VA1=tons shipped to customer A from warehouse W1. This exercise contains only parts b, c, d, e, and f. Part 2 b) The objective function for the LP model =arrow_forwardallons of deionized water from each wholesaler to each distribution center is shown in the following table: Question Viewer a. Which of the following statements regarding setting up the tableau for the optimal solution for this problem is true? B. The sum of supply capacities is greater than the sum of demands, so a dummy distribution center is needed. C. The sum of supply capacities is less than the sum of demands, so a dummy wholesaler is needed. b. What is the total cost of the solution? The optimal cost is $ ((Enter your response rounded to the nearest dollar.)arrow_forward
- The following data structure and constraints exist for a magazine publishing company:a. The company publishes one regional magazine in each of four states: Florida (FL), South Carolina (SC), Georgia (GA), and Tennessee (TN).b. The company has 300,000 customers (subscribers) distributed throughout the four states listed in Problem 2a.c. On the first day of each month, an annual subscription INVOICE is printed and sent to each customer whose subscription is due for renewal. The INVOICE entity contains a REGION attribute to indicate the customer's state of residence (FL, SC, GA, TN):The company is aware of the problems associated with centralized management and has decided to decentralize management of the subscriptions into the company's four regional subsidiaries. Each subscription site will handle its own customer and invoice data. The management at company headquarters, however, will have access to customer and invoice data to generate annual reports and to issue ad hoc queries such…arrow_forwardA retail store in Des Moines, Iowa, receives shipments of a particular product from KansasCity and Minneapolis. Let x 5 number of units of the product received from Kansas City y 5 number of units of the product received from Minneapolisa. Write an expression for the total number of units of the product received by the retail store in Des Moines. b. Shipments from Kansas City cost $0.20 per unit, and shipments from Minneapolis cost$0.25 per unit. Develop an objective function representing the total cost of shipments to Des Moines. c. Assuming the monthly demand at the retail store is 5000 units, develop a constraint that requires 5000 units to be shipped to Des Moines. d. No more than 4000 units can be shipped from Kansas City, and no more than 3000 units can be shipped from Minneapolis in a month. Develop constraints to model this situation. e. Of course, negative amounts cannot be shipped. Combine the objective function and constraints developed to state a mathematical model…arrow_forwardgiven the transportation problem, assume that the demands at the 4 destinations are 5, 5, 7, and 8 units, respectively, and the supplies at the 4 sources are 7, 3, 7 and 8 units, respectively.C₁₁=7ㅤ C₁₂=9ㅤ C₁₃ = 1ㅤ C₁₄ = 10 C₂₁= 22ㅤ C₂₂ = 25ㅤ C₂₃ = 16ㅤ C₂₄ = 26 С₃₁ = 28ㅤ C₃₂ = 32ㅤ C₃₃ = 24ㅤ Сз₄ = 32 C₄₁ = 12ㅤ C₄₂ = 14ㅤ C₄з = 6ㅤ C₄₄ = 16where m=4, n=4what is the optimal solution using vogel's approximation method, least-cost method, and northwest-corner rule?arrow_forward
- solve for y in part barrow_forwardLong-Life Insurance has developed a linear model that it uses to determine the amount of term life insurance a family of four should have, based on the current age of the head of the household. The equation is:y = 850 − .1xwherey = Insurance needed ($000)x = Current age of head of household a. Plot the relationship on a graph. b. Use the equation to determine the amount of term life insurance to recommend for a family of four if the head of the household is 30 years old.arrow_forwardplease answer the following question a , b, c, d using execl solver ?arrow_forward
- b) The Scott Tractor Company ships tractor parts from Omaha to St. Louis by railroad. However, a contract limits the number of railroad cars the company can secure on each branch/arc during a week. Given these limiting conditions, the company wants to know the maximum number of railroad cars containing tractor parts that can be shipped from Omaha to St. Louis during a week. Phoenix Des Moines 3 5 6. 6. 1. Dallas 2 Omaha St. Louis 7. 3 Denver 6. ActivateW O 31°Carrow_forwardCompanies A, B, and C supply components to three plants (F, G, and H) via two crossdocking facilities (D and E). It costs $4 to ship from D regardless of final destination and $3 to ship to E regardless of supplier. Shipping to D from A, B, and C costs $3, $4, and $5, respectively, and shipping from E to F, G, and H costs $10, $9, and $8, respectively. Suppliers A, B, and C can provide 200, 300 and 500 units respectively and plants F, G, and H need 350, 450, and 200 units respectively. Crossdock facilities D and E can handle 600 and 700 units, respectively. Logistics Manager, Aretha Franklin, had previously used "Chain of Fools" as her supply chain consulting company, but now turns to you for some solid advice. What is the objective function? Group of answer choices Max Z = $3AD + $3AE + $4BD + $3BE + $5CD + $3CE + $4DF + $4DG + $4DH + $10EF + $9EG + $8EH Min Z = $3AD + $3AE + $4BD + $3BE + $5CD + $3CE + $4DF + $4DG + $4DH + $10EF + $9EG + $8EH Min Z = $3AD + $3BE + $5CD + $3CE…arrow_forwardCompanies A, B, and C supply components to three plants (F, G, and H) via two crossdocking facilities (D and E). It costs $4 to ship from D regardless of final destination and $3 to ship to E regardless of supplier. Shipping to D from A, B, and C costs $3, $4, and $5, respectively, and shipping from E to F, G, and H costs $10, $9, and $8, respectively. Suppliers A, B, and C can provide 200, 300 and 500 units respectively and plants F, G, and H need 350, 450, and 200 units respectively. Crossdock facilities D and E can handle 600 and 700 units, respectively. Logistics Manager, Aretha Franklin, had previously used "Chain of Fools" as her supply chain consulting company, but now turns to you for some solid advice. Set up the solution in Excel and solve with Solver. What are total costs?arrow_forward
 Practical Management ScienceOperations ManagementISBN:9781337406659Author:WINSTON, Wayne L.Publisher:Cengage,