
Essentials Of Business Analytics
1st Edition
ISBN: 9781285187273
Author: Camm, Jeff.
Publisher: Cengage Learning,
expand_more
expand_more
format_list_bulleted
Concept explainers
Videos
Textbook Question
Chapter 4, Problem 14P
A study investigated the relationship between audit delay (the length of time from a company’s fiscal year-end to the date of the auditor’s report) and variables that describe the client and the auditor. Some of the independent variables that were included in this study follow:
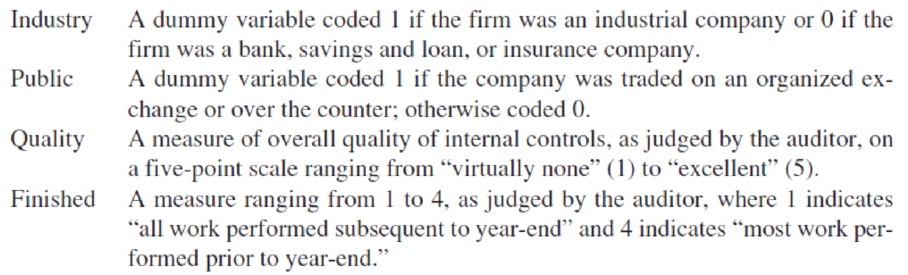
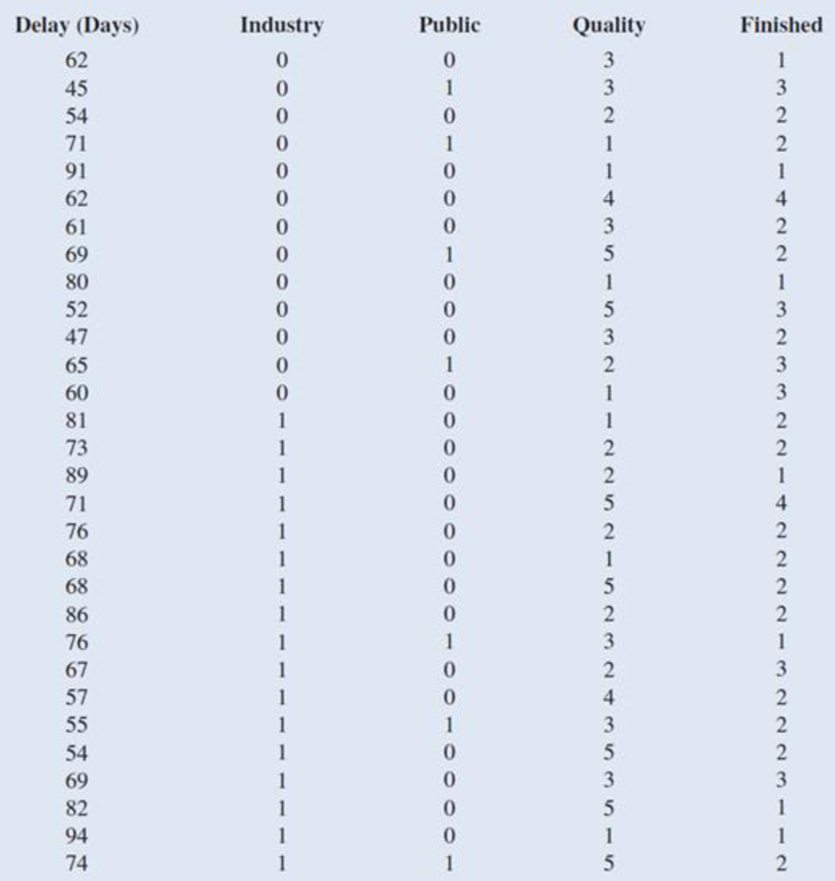
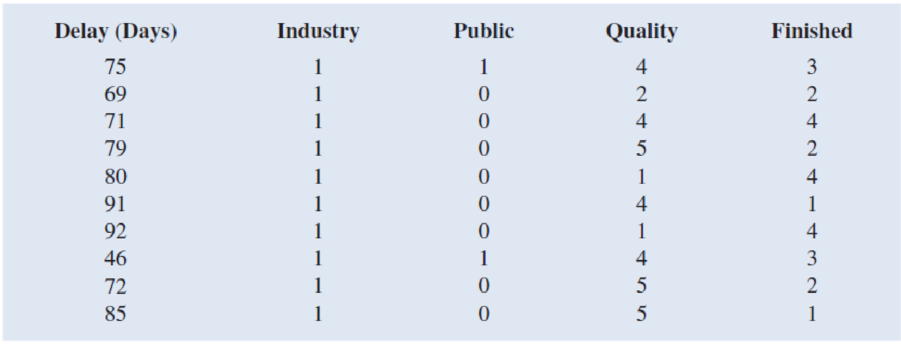
A sample of 40 companies provided the following data:
- a. Develop the estimated regression equation using all of the independent variables included in the data.
- b. Test for an overall regression relationship at the 0.05 level of significance. Is there a significant regression relationship?
- c. How much of the variation in the sample values of delay does this estimated regression equation explain? What other independent variables could you include in this regression model to improve the fit?
- d. Test the relationship between each independent variable and the dependent variable at the 0.05 level of significance, and interpret the relationship between each of the independent variables and the dependent variable.
- e. On the basis of your observations about the relationships between the dependent variable Delay and the independent variables Quality and Finished, suggest an alternative regression equation to the model developed in part a to explain as much of the variability in Delay as possible.
Expert Solution & Answer
Want to see the full answer?
Check out a sample textbook solution
Students have asked these similar questions
During busy political seasons, many opinion polls are conducted. In apresidential race, how do you think the participants in polls are generally selected?Discuss any issues regarding simple random, stratified, systematic, cluster, andconvenience sampling in these polls. What about other types of polls, besides political?
Please could you explain why 0.5 was added to each upper limpit of the intervals.Thanks
28. (a) Under what conditions do we say that two random variables X and Y are
independent?
(b) Demonstrate that if X and Y are independent, then it follows that E(XY) =
E(X)E(Y);
(e) Show by a counter example that the converse of (ii) is not necessarily true.
Chapter 4 Solutions
Essentials Of Business Analytics
Ch. 4 - Bicycling World, a magazine devoted to cycling,...Ch. 4 - In a manufacturing process the assembly line speed...Ch. 4 - Jensen Tire Auto is deciding whether to purchase...Ch. 4 - A sociologist was hired by a large city hospital...Ch. 4 - The regional transit authority for a major...Ch. 4 - A marketing professor at Givens College is...Ch. 4 - The Dow Jones Industrial Average (DJIA) and the...Ch. 4 - The Toyota Camry is one of the best-selling cars...Ch. 4 - Dixie Showtime Movie Theaters, Inc., owns and...Ch. 4 - Prob. 10P
Ch. 4 - The American Association of Individual Investors...Ch. 4 - The National Football League (NFL) records a...Ch. 4 - Johnson Filtration. Inc., provides maintenance...Ch. 4 - A study investigated the relationship between...Ch. 4 - The U.S. Department of Energys Fuel Economy Guide...Ch. 4 - A highway department is studying the relationship...Ch. 4 - A sample containing years to maturity and...Ch. 4 - In 2011, home prices and mortgage rates fell so...Ch. 4 - A recent 10-year study conducted by a research...Ch. 4 - The Scholastic Aptitude Test (or SAT) is a...Ch. 4 - Consider again the example introduced in Section...Ch. 4 - Alumni donations are an important source of...
Knowledge Booster


Learn more about
Need a deep-dive on the concept behind this application? Look no further. Learn more about this topic, statistics and related others by exploring similar questions and additional content below.Similar questions
- 19. Let X be a non-negative random variable. Show that lim nE (IX >n)) = 0. E lim (x)-0. = >arrow_forward(c) Utilize Fubini's Theorem to demonstrate that E(X)= = (1- F(x))dx.arrow_forward(c) Describe the positive and negative parts of a random variable. How is the integral defined for a general random variable using these components?arrow_forward
- 26. (a) Provide an example where X, X but E(X,) does not converge to E(X).arrow_forward(b) Demonstrate that if X and Y are independent, then it follows that E(XY) E(X)E(Y);arrow_forward(d) Under what conditions do we say that a random variable X is integrable, specifically when (i) X is a non-negative random variable and (ii) when X is a general random variable?arrow_forward
arrow_back_ios
SEE MORE QUESTIONS
arrow_forward_ios
Recommended textbooks for you
 Big Ideas Math A Bridge To Success Algebra 1: Stu...AlgebraISBN:9781680331141Author:HOUGHTON MIFFLIN HARCOURTPublisher:Houghton Mifflin Harcourt
 Glencoe Algebra 1, Student Edition, 9780079039897...AlgebraISBN:9780079039897Author:CarterPublisher:McGraw Hill
 Functions and Change: A Modeling Approach to Coll...AlgebraISBN:9781337111348Author:Bruce Crauder, Benny Evans, Alan NoellPublisher:Cengage Learning
Big Ideas Math A Bridge To Success Algebra 1: Stu...
Algebra
ISBN:9781680331141
Author:HOUGHTON MIFFLIN HARCOURT
Publisher:Houghton Mifflin Harcourt
Glencoe Algebra 1, Student Edition, 9780079039897...
Algebra
ISBN:9780079039897
Author:Carter
Publisher:McGraw Hill
Functions and Change: A Modeling Approach to Coll...
Algebra
ISBN:9781337111348
Author:Bruce Crauder, Benny Evans, Alan Noell
Publisher:Cengage Learning
Correlation Vs Regression: Difference Between them with definition & Comparison Chart; Author: Key Differences;https://www.youtube.com/watch?v=Ou2QGSJVd0U;License: Standard YouTube License, CC-BY
Correlation and Regression: Concepts with Illustrative examples; Author: LEARN & APPLY : Lean and Six Sigma;https://www.youtube.com/watch?v=xTpHD5WLuoA;License: Standard YouTube License, CC-BY