
a)
To find:
Graphical representation of C’s productivity curve.
a)
Explanation of Solution
This is a case of constant returns to scale. As both inputs and output level of production is same, the productivity growth seems like this:
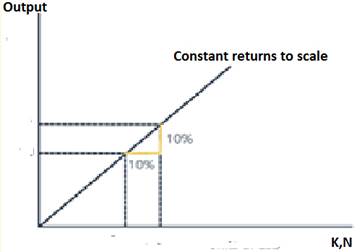
Productivity curve is a graphical representation showing level of production with different level of inputs.
b)
Graphical representation of C’s productivity curve.
b)
Explanation of Solution
This is a case of increasing returns to scale. As the input goes in production function, the level of production increases at an increasing rates. As the output increases more than the level of input introduced in the production function, then output is said to be increasing returns to scale.
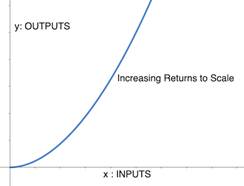
Productivity curve is a graphical representation showing level of production with different level of inputs.
c)
Graphical representation of C’s productivity curve.
c)
Explanation of Solution
As the physical capital destroyed, keeping other things constant, the level of output production decreases. The output production function shifts downward, showing the fall in the productivity level of output.
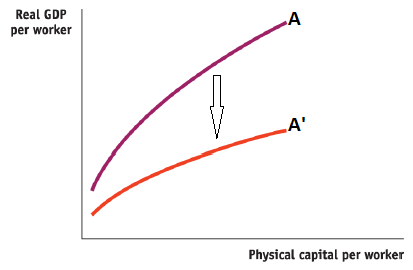
Productivity curve is a graphical representation showing level of production with different level of inputs.
d)
Graphical representation of C’s productivity curve.
d)
Explanation of Solution
The productivity curve of C shifts upward as the level of production increases due to education. As education level increases, human capital level increases, this leads to usage of existing capital, thereby increasing the level of productivity.
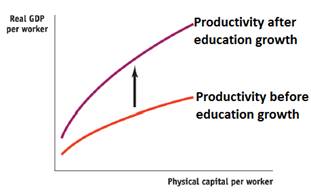
Productivity curve is a graphical representation showing level of production with different level of inputs.
Chapter 38 Solutions
Krugman's Economics For The Ap® Course


 Principles of Economics (12th Edition)EconomicsISBN:9780134078779Author:Karl E. Case, Ray C. Fair, Sharon E. OsterPublisher:PEARSON
 Engineering Economy (17th Edition)EconomicsISBN:9780134870069Author:William G. Sullivan, Elin M. Wicks, C. Patrick KoellingPublisher:PEARSON
 Principles of Economics (MindTap Course List)EconomicsISBN:9781305585126Author:N. Gregory MankiwPublisher:Cengage Learning
 Managerial Economics: A Problem Solving ApproachEconomicsISBN:9781337106665Author:Luke M. Froeb, Brian T. McCann, Michael R. Ward, Mike ShorPublisher:Cengage Learning
 Managerial Economics & Business Strategy (Mcgraw-...EconomicsISBN:9781259290619Author:Michael Baye, Jeff PrincePublisher:McGraw-Hill Education