
Concept explainers
Videos
Marginal tax rate. Businesses and individuals are frequently concerned about their marginal tax rate, or the rate at which the next dollar earned is taxed. In progressive taxation, the 80,001st dollar earned is taxed at a higher rate than the 25,001st dollar earned and at a lower rate than the 140,001st dollar earned. Use the following graph, showing the marginal tax rate for 2018 for single filers, to answer Exercises 49–52.
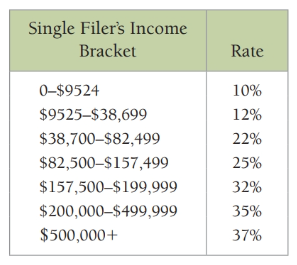
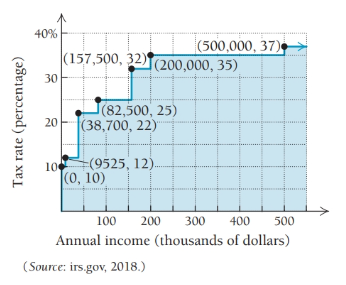
50. Marcy and Tyrone work for the same marketing agency. Because she is not yet a partner, Marcy’s year-end income is approximately $95,000; Tyrone’s year-end income is approximately $190,000. Suppose one of them is to receive another $5000 in income for the year. Which one would keep more of that $5000 after taxes? Why?
Want to see the full answer?
Check out a sample textbook solution
Chapter 3 Solutions
CALCULUS+ITS APPLICATIONS


- Suppose classmates who graduated in 2004 compared their median incomes ten years later. The bar graph displays the median income, in thousands of dollars, for each classmate during the time intervals from 2005‑2009 and 2010‑2014. For the individual with the largest dollar value increase in median income over the two time intervals, determine the amount of increase.arrow_forwardThe passage of the Social Security Amendments of 1965 resulted in the creation of the Medicare and Medicaid programs. Since then, the percent of persons 65 years and over with family income below the poverty level has declined. The percent can be approximated byP(t)=30.6-4.77lnt,where t is the number of years since 1965.a. Find the percent of persons 65 years and over with family income below the poverty level in 1990. Round to the nearest tenth. %b. When will the percent of persons 65 years and over with family income below the poverty level reach 16?The percent of persons 65 years and over with family income below the poverty level reach 16 in the year (Round to the nearest year.)arrow_forwardUse this information to solve Exercises 9–11:A company is planning to produce and sell a new line of computers. The fixed cost will be $360,000 and it will cost $850 to produce each computer. Each computer will be sold for $1150. 9. Write the cost function, C, of producing x computers. 10. Write the revenue function, R, from the sale of x computers. 11. Determine the break-even point. Describe what this means.arrow_forward
- The table gives the yearly sales, S, of a retail store in years.arrow_forward8–33. On Black Friday, Amazon.com featured an Echo 2nd Generation for $35 normally selling for $79. Calculate the dollar markdown and the markdown percent based on the selling price to the nearest whole percent.arrow_forwardConsider a species that occupies a large, but fixed, number of islands. The distribution of the species across all islands is maintained by a balance between local extinctions and local colonization events. Devise a mathematical model (equation) for the relationship between the fraction of islands occupied by the species and time. Be clear to outline the assumptions you make and be sure to describe your key predictions. Explain what each part of the equation represents.arrow_forward
- World Military Expenditure The following chart shows total military and arms trade expenditure from 2011–2020 (t = 1 represents 2011). †A bar graph titled "World military expenditure" has a horizontal t-axis labeled "Year since 2010" and a vertical axis labeled "$ (billions)". The bar graph has 10 bars. Each bar is associated with a label and an approximate value as listed below. 1: 1,800 billion dollars 2: 1,775 billion dollars 3: 1,750 billion dollars 4: 1,730 billion dollars 5: 1,760 billion dollars 6: 1,760 billion dollars 7: 1,850 billion dollars 8: 1,900 billion dollars 9: 1,950 billion dollars 10: 1,980 billion dollars (a) If you want to model the expenditure figures with a function of the form f(t) = at2 + bt + c, would you expect the coefficient a to be positive or negative? Why? HINT [See "Features of a Parabola" in this section.] We would expect the coefficient to be positive because the curve is concave up. We would expect the coefficient to be negative because the…arrow_forwardExercises 93–94: Energy The following graph shows U.S. Energy consumption. 400 350 300 250 200 150 100 50 04 1970 1990 2010 Year 93. When was energy consumption increasing? 94. When was energy consumption decreasing? Energy (millions of Btu)arrow_forwardThe bar graph shows the average cost of tuition and fees at private four-year colleges in a particular country. Below are two mathematical models for the data shown in the graph. In each formula, T represents the average cost of tuition and fees at private colleges for the school year ending x years after 2000. Answer parts a and b. Average Cost of Tuition and Fees at Private Four-Year Colleges 22 20- 22,051 21,057 20,095 19,128 18,135 18- 16.203 16 15 218 17,168 Model 1 T= 974x+ 15,223 Model 2 T= - 2.1x + 988x + 15,208 14 2000 2001 20022003 2004 2005 2006 2007 a. Use each model to find the average cost of tuition and fees at private colleges for the school vear ending in 2003. By how much does each model underestimate or overestimate the actual cost shown for the school year ending in 2003? HIHE The average cost given by model 1 is $ Round to the nearest dollar.) Help Me Solve This Textbook Get More Help - Clear All Skill Builder Check Answer 10.19 PM 65°F 9/6/2021 Type here to search…arrow_forward
- A vehicle purchased for $25,000 depreciates at a constant rate of 9% per year. Determine the approximate value of the vehicle 12 years after purchase. Round to the nearest whole dollar. 2$ Preview Get help: Video MacBook Pro G Search or type URL 5944 (6\ %2$ & 3 5 6. 7 8. E R T Y D F G H. K C B command option V しのarrow_forwardPlease explain. I don't understand dispersion.arrow_forwardInterpret the average rate of change. U.S. education expenditure, as a percentage of total federal spending, is projected to have decreased by this amount per day during 2009-2019. U.S. education expenditure, as a percentage of total federal spending, is projected to have decreased by this amount per month during 2009-2019. U.S. education expenditure, as a percentage of total federal spending, is projected to have increased by this amount per day during 2009-2019. U.S. education expenditure, as a percentage of total federal spending, is projected to have increased by this amount per year during 2009-2019. U.S. education expenditure, as a percentage of total federal spending, is projected to have increased by this amount per month during 2009-2019. (b) Compute the average rate of change over the period [15, 19]. Interpret the average rate of change. U.S. education expenditure, as a percentage of total federal spending, is projected to have increased by this amount per day during…arrow_forward
 College Algebra (MindTap Course List)AlgebraISBN:9781305652231Author:R. David Gustafson, Jeff HughesPublisher:Cengage Learning
 Algebra & Trigonometry with Analytic GeometryAlgebraISBN:9781133382119Author:SwokowskiPublisher:Cengage
 Algebra: Structure And Method, Book 1AlgebraISBN:9780395977224Author:Richard G. Brown, Mary P. Dolciani, Robert H. Sorgenfrey, William L. ColePublisher:McDougal Littell