Concept explainers
Videos
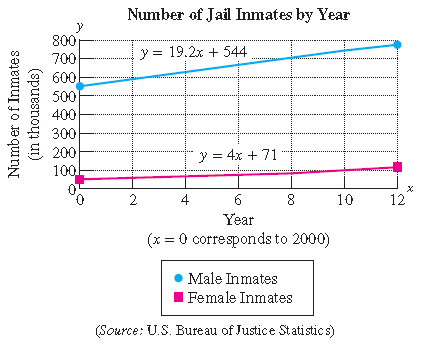
The graph depicts the rise in the number of jail inmates in the United States since 2000. Two linear equations are given: one to describe the number of female inmates and one to describe the number of male inmates by year.
Let y represent the number of inmates (in thousands).
Let x represent the number of years since 2000.
a.What is the slope of the line representing the number of female inmates? Interpret the meaning of the slope in the context of this problem.
b.What is the slope of the line representing the number of male inmates? Interpret the meaning of the slope in the context of this problem.
c.Which group, males or females, has the larger slope? What does this imply about the rise in the number of male and female prisoners?
d.Assuming this trend continues, use the equation to predict the number of female inmates in
Want to see the full answer?
Check out a sample textbook solution
Chapter 3 Solutions
Beginning and Intermediate Algebra


- Please help me with these questions. I am having a hard time understanding what to do. Thank youarrow_forwardAnswersarrow_forward************* ********************************* Q.1) Classify the following statements as a true or false statements: a. If M is a module, then every proper submodule of M is contained in a maximal submodule of M. b. The sum of a finite family of small submodules of a module M is small in M. c. Zz is directly indecomposable. d. An epimorphism a: M→ N is called solit iff Ker(a) is a direct summand in M. e. The Z-module has two composition series. Z 6Z f. Zz does not have a composition series. g. Any finitely generated module is a free module. h. If O→A MW→ 0 is short exact sequence then f is epimorphism. i. If f is a homomorphism then f-1 is also a homomorphism. Maximal C≤A if and only if is simple. Sup Q.4) Give an example and explain your claim in each case: Monomorphism not split. b) A finite free module. c) Semisimple module. d) A small submodule A of a module N and a homomorphism op: MN, but (A) is not small in M.arrow_forward
- I need diagram with solutionsarrow_forwardT. Determine the least common denominator and the domain for the 2x-3 10 problem: + x²+6x+8 x²+x-12 3 2x 2. Add: + Simplify and 5x+10 x²-2x-8 state the domain. 7 3. Add/Subtract: x+2 1 + x+6 2x+2 4 Simplify and state the domain. x+1 4 4. Subtract: - Simplify 3x-3 x²-3x+2 and state the domain. 1 15 3x-5 5. Add/Subtract: + 2 2x-14 x²-7x Simplify and state the domain.arrow_forwardQ.1) Classify the following statements as a true or false statements: Q a. A simple ring R is simple as a right R-module. b. Every ideal of ZZ is small ideal. very den to is lovaginz c. A nontrivial direct summand of a module cannot be large or small submodule. d. The sum of a finite family of small submodules of a module M is small in M. e. The direct product of a finite family of projective modules is projective f. The sum of a finite family of large submodules of a module M is large in M. g. Zz contains no minimal submodules. h. Qz has no minimal and no maximal submodules. i. Every divisible Z-module is injective. j. Every projective module is a free module. a homomorp cements Q.4) Give an example and explain your claim in each case: a) A module M which has a largest proper submodule, is directly indecomposable. b) A free subset of a module. c) A finite free module. d) A module contains no a direct summand. e) A short split exact sequence of modules.arrow_forward
- Listen ANALYZING RELATIONSHIPS Describe the x-values for which (a) f is increasing or decreasing, (b) f(x) > 0 and (c) f(x) <0. y Af -2 1 2 4x a. The function is increasing when and decreasing whenarrow_forwardBy forming the augmented matrix corresponding to this system of equations and usingGaussian elimination, find the values of t and u that imply the system:(i) is inconsistent.(ii) has infinitely many solutions.(iii) has a unique solutiona=2 b=1arrow_forwardif a=2 and b=1 1) Calculate 49(B-1)2+7B−1AT+7ATB−1+(AT)2 2)Find a matrix C such that (B − 2C)-1=A 3) Find a non-diagonal matrix E ̸= B such that det(AB) = det(AE)arrow_forwardarrow_back_iosSEE MORE QUESTIONSarrow_forward_ios
 Glencoe Algebra 1, Student Edition, 9780079039897...AlgebraISBN:9780079039897Author:CarterPublisher:McGraw Hill
 Elementary AlgebraAlgebraISBN:9780998625713Author:Lynn Marecek, MaryAnne Anthony-SmithPublisher:OpenStax - Rice University
 Holt Mcdougal Larson Pre-algebra: Student Edition...AlgebraISBN:9780547587776Author:HOLT MCDOUGALPublisher:HOLT MCDOUGAL

 Intermediate AlgebraAlgebraISBN:9781285195728Author:Jerome E. Kaufmann, Karen L. SchwittersPublisher:Cengage Learning