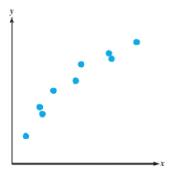
For Exercises 35-38, a graph of data is given. From visual inspection, which model would best fit the data? Choose from y = m x + b linear y = a b x exponential y = a + b ln x logarithmic y = c 1 + a e − b x logistic
For Exercises 35-38, a graph of data is given. From visual inspection, which model would best fit the data? Choose from y = m x + b linear y = a b x exponential y = a + b ln x logarithmic y = c 1 + a e − b x logistic
Solution Summary: The author explains how to determine the model equation which is the best fit for the given data by using virtual inspection.
Bacteria growth was measured over a one-month period. Scatterplot A displays the number of cells measured over the recorded number of days. Two transformations of the data are shown in the next two graphs. Scatterplot B displays the relationship between the number of days and the natural log of the number of cells of bacteria. Scatterplot C displays the relationship between the natural log of the number of days and the natural log of the number of cells of bacteria.
Which model best represents the relationship between the number of days and the number of cells of bacteria?
A linear model would best represent the relationship because scatterplot A is fairly linear.
An exponential model would best represent the relationship because scatterplot B is fairly linear.
A linear model would best represent the relationship because scatterplot B is fairly linear.
A power model would best represent the relationship because scatterplot C is fairly linear.
Need a deep-dive on the concept behind this application? Look no further. Learn more about this topic, calculus and related others by exploring similar questions and additional content below.
Which is the best chart: Selecting among 14 types of charts Part II; Author: 365 Data Science;https://www.youtube.com/watch?v=qGaIB-bRn-A;License: Standard YouTube License, CC-BY


 Glencoe Algebra 1, Student Edition, 9780079039897...AlgebraISBN:9780079039897Author:CarterPublisher:McGraw Hill
 Algebra & Trigonometry with Analytic GeometryAlgebraISBN:9781133382119Author:SwokowskiPublisher:Cengage
 Trigonometry (MindTap Course List)TrigonometryISBN:9781337278461Author:Ron LarsonPublisher:Cengage Learning
 Calculus For The Life SciencesCalculusISBN:9780321964038Author:GREENWELL, Raymond N., RITCHEY, Nathan P., Lial, Margaret L.Publisher:Pearson Addison Wesley,