Concept explainers
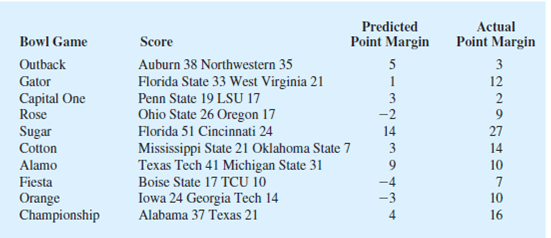
Ten major college football bowl games were played in January 2010, with the University of Alabama beating the University of Texas 37 to 21 to become the national champion of college football. The results of the 10 bowl games follow (USA today, January 8, 2010).

The predicted winning point margin was based on Las Vegas betting odds approximately one week before the bowl games were played. For example, Auburn was predicted to beat Northwestern in the Outback Bowl by five points. The actual winning point margin for Auburn was three points. A negative predicted winning point margin means that the team that won the bowl game was an underdog and expected to lose. For example, in the Rose Bowl, Ohio State was a two-point underdog to Oregon and ended up winning by nine points.
- a. Develop a
scatter diagram with predicted point margin on the horizontal axis. - b. What is the relationship between predicted and actual point margins?
- c. Compute and interpret the sample
covariance . - d. Compute the sample
correlation coefficient . What does this value indicate about the relationship between the Las Vegas predicted point margin and the actual point margin in college football bowl games?
Trending nowThis is a popular solution!

Chapter 3 Solutions
STATISTICS F/BUSINESS+ECONOMICS-TEXT
- Please answer and show workarrow_forwardplease answer and show workarrow_forwardSuppose you want to have $300,000 for retirement in 25 years. Your account earns 8% interest. a) How much would you need to deposit in the account each month? SA $ b) How much interest will you earn? $1 Message instructor Enter an integer or decimal number [more..] Question Help: Video Submit Question esc ! 1 F1 F2 80 F3 # $ 2 3 4 Ơ ☑ F4 F5 % <6 olo 50 F6 A F7 Q W E R T Y ab A lock Z S X D C 7 LL F G Harrow_forward
- please answer and show workarrow_forwardAssume there is a certain population of fish in a pond whose growth is described by the logistic equation. It is estimated that the carrying capacity for the pond is 1900 fish. Absent constraints, the population would grow by 230% per year. If the starting population is given by po = 400, then after one breeding season the population of the pond is given by P1 = = After two breeding seasons the population of the pond is given by P2 = Question Help: Video 1 Video 2 Message instructor Submit Question 80 esc F1 F2 F3 1 01 F4 F5 F6 # $ % 2 3 4 5 66 Q W E R T Y tab A caps lock shift fn S D & ཏུ་ F7 7 LL F G H ก כ Z X C V B M Harrow_forwardplease answer and show work!arrow_forward
- Algebra & Trigonometry with Analytic GeometryAlgebraISBN:9781133382119Author:SwokowskiPublisher:Cengage
