Concept explainers
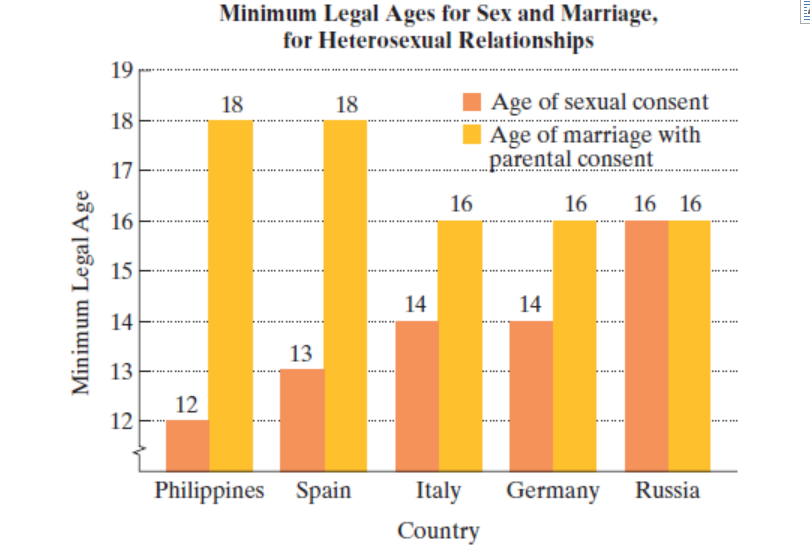
The bar graph shows minimum legal ages for sex and marriage in five selected countries. Use this information to solve Exercises 39-40. (We did not include data for the United States because the legal age of sexual consent varies according to states law. Furthermore, women are allowed to marry younger than men: 16 for women and 18 for men.)
Minimum Legal Ages for Sex and Marriage, for Heterosexual Relationships
 Source: Mitchell Beazley, Snapshot: The Visual Almanac for Our World Today. Octopus Publishing, 2009.
a. Consider the statement
If the country is Italy, then the age of sexual consent is 14.
Use the information given by the graph to determine the truth value of this conditional statement.
b. Write the converse, inverse, and contrapositive of the statement in part (a). Then use information given by the graph to determine whether each statement is true or not necessarily true.
Want to see the full answer?
Check out a sample textbook solution
Chapter 3 Solutions
Thinking Mathematically (6th Edition)
- Name the four characteristics of a good definition.arrow_forwardIs it possible that P(AB)=P(A)? Explain.arrow_forwardA store manager, using his data for the past four years, presents his sales using a bar graph. Under what branch of Statistics does this belong? a) Descriptive statistics c) Qualitative data b) Inferential statistics d) Quantitative dataarrow_forward
- The higher education department of Holmes Institute recorded data on the number of students enrolled in the different study majors for the years 2018 and 2019. Study major 2018 2019 Statistics 1700 2250 Business law 700 900 Accounting 1300 1450 Economics 750 1000 Finance 1450 1758 Marketing management 1069 1189 Auditing 360 351 Use an appropriate graphical technique or chart to compare the number of enrolment in 2018 and 2019 of the different study major. Display the chart. Use an appropriate graphical technique or chart to display the percentage value of the number of enrolment of the different study major in 2018 and 2019. Display the chart.arrow_forwardThe idea that some educational requirements are necessary for many jobs today is calleda. status grouping.b. credentialism.c. meritocracy.d. conflictarrow_forward200 180 160 140 120 100 60 40 20 Jar Feb Miar Apri May lun, sHears Dolphine Whales The data in the bar graph above was created by a wilderness photographer and lists the number of photos she took of each type of three mammals (bears, dolphins, and whales) from January to June. According to the photographer's data, which of the following statements is not true? A) The photographer took more photos in May than she did in April. B) The number of photos she captured of dolphins each month decreased C) The number of photos of w hales she took each month increased D) The month in which she took the least number of photos was Februaryarrow_forward
- The Current Results website lists the average annual high and low temperatures (degreesfahrenheit) and average annual snowfall (inches) for fifty-one major U.S. cities, based ondata from 1981 to 2010. The data are contained in the file Snow. for example, the average low temperature for Columbus, Ohio is 44 degrees and the average annual snowfallis 27.5 inches.a. Construct a scatter diagram with the average annual low temperature on the horizontalaxis and the average annual snowfall on the vertical axisarrow_forwardPart c and d? It says it’s wrong.arrow_forwardDashboard C YouTube X M MyOpenMath ✔ Hints myopenmath.com/assess2/index.php?cid=167606&aid=11945494&r=641ba54e2ba44#/skip/13 myMCC | Middlesex... Dashboard = Google Docs NJ Athletic Confere... a) 68% of the students spend between b) 95% of the students spend between c) 99.7% of the students spend between Question Help: Submit Question Jump to Answer Untitled document - Google X ■ ■ For a 4-unit class like Statistics, students should spend average of 12 hours studying for the class. A survey was done on 23 students, and the distribution of total study hours per week is bell-shaped with a mean of 14 hours and a standard deviation of 3.4 hours. Use the Empirical Rule to answer the following questions. Q Search 2021 Football Stan... V 2021-2022 D3 Colle... GroupMe P Plagiarism Checker... MyOpen Math hours and hours and Written Example Message instructor Sy 1-(30)^5 hours and Answered: How the Classic X + VitalSource Booksh... hours on Statistics each week. 19 ☆ hours on Statistics each…arrow_forward
- Please help. Step by step.arrow_forwardCreate properly formatted tables that compare the prevalence of obesity with respect to sex and level of physical activity. Discuss the results briefly. pal (physical activity) = Student’s perceived physical activity. Physically active is defined as having spent an estimated daily total of 10 mins of extraneous or 30 min of moderate physical activity per day. legend: 1 – Sedentary 2 – Light 3 – Moderate 4 – Vigorousarrow_forwardThe book The Wall Street Journal. Guide to Information Graphics by Dona M. Wong gives strategies for using graphs and charts to display information effectively. One popular graph discussed is the donut pie chart. The donut pie chart is simply a pie chart with the center removed. A recent Harris Poll asked adults about their opinions regarding whether books should be banned from libraries because of social, language, violent, sexual, or religious content. The responses by education level to the question "Do you think that there are any books which should be banned completely?" are shown in the following donut pie charts. (a) What feature of Keith's graph makes it difficult to visually compare the responses of those with some college to those shown in the other graphs? (Select all that apply.) a)The graphs made by Keith and Ramon compare groups across education level. b)The graphs made by Keith and Ramon are all donut pie charts. c)The graphs do not have data labels showing the…arrow_forward
 Algebra: Structure And Method, Book 1AlgebraISBN:9780395977224Author:Richard G. Brown, Mary P. Dolciani, Robert H. Sorgenfrey, William L. ColePublisher:McDougal Littell
 Holt Mcdougal Larson Pre-algebra: Student Edition...AlgebraISBN:9780547587776Author:HOLT MCDOUGALPublisher:HOLT MCDOUGAL
 Glencoe Algebra 1, Student Edition, 9780079039897...AlgebraISBN:9780079039897Author:CarterPublisher:McGraw Hill
 Elementary Geometry For College Students, 7eGeometryISBN:9781337614085Author:Alexander, Daniel C.; Koeberlein, Geralyn M.Publisher:Cengage,
 College Algebra (MindTap Course List)AlgebraISBN:9781305652231Author:R. David Gustafson, Jeff HughesPublisher:Cengage Learning


