
APPLIED STAT.IN BUS.+ECONOMICS
6th Edition
ISBN: 9781259957598
Author: DOANE
Publisher: RENT MCG
expand_more
expand_more
format_list_bulleted
Concept explainers
Videos
Textbook Question
Chapter 3.5, Problem 16SE
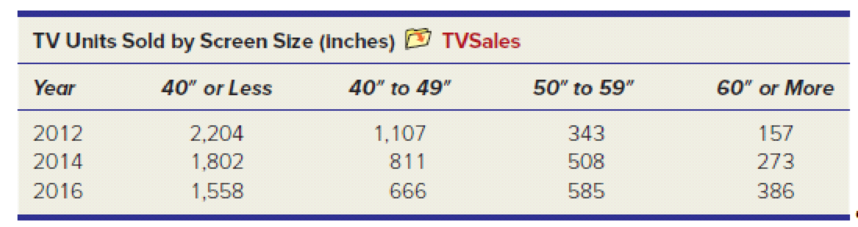
The table shows the number of TVs sold by a major retailer in California for three years. (a) Use Excel to prepare a 2-D side-by-side column chart with screen size on the horizontal axis. (b) Change your graph to a 3-D side-by-side column chart. Is 3-D better than 2-D? Explain. (c) Change the chart type to a 3-D stacked column chart. Is the stacked chart a better way to compare sales over time or among screen sizes? (d) Right-click the data series, choose Add Data Labels, and add labels to the data. Do the labels help or hinder viewer understanding?
Expert Solution & Answer
Want to see the full answer?
Check out a sample textbook solution
Students have asked these similar questions
Help! I'm just asking how to graph the table shown in the picture. Nothing else.
Please choose the problem that matches the schematic view with the best correspondance.
The Sugar Sweet Company needs to transport sugar to market. The graph
below shows the transporting cost (in dollars) versus the weight of the
sugar being transported (in tons).
Use the graph to answer the questions.
Chapter 3 Solutions
APPLIED STAT.IN BUS.+ECONOMICS
Ch. 3.1 - (a) Make a stem-and-leaf plot for these 24...Ch. 3.1 - (a) Make a stem-and-leaf plot for the number of...Ch. 3.1 - (a) Make a stacked dot plot to compare the lengths...Ch. 3.2 - (a) The table shows the number of days on the...Ch. 3.2 - (a) The table shows raw scores on a state civil...Ch. 3.2 - (a) Make a frequency distribution and histogram...Ch. 3.2 - (a) Make a frequency distribution and histogram...Ch. 3.2 - (a) Make a frequency distribution and histogram...Ch. 3.2 - For each frequency distribution, suggest nice...Ch. 3.2 - Below are sorted data showing average spending per...
Ch. 3.4 - (a) Use Excel to prepare a line chart to display...Ch. 3.4 - Prob. 12SECh. 3.4 - Prob. 13SECh. 3.4 - (a) Use Excel to prepare a line chart to display...Ch. 3.5 - Prob. 15SECh. 3.5 - The table shows the number of TVs sold by a major...Ch. 3.6 - (a) Use Excel to prepare a 2-D pie chart for these...Ch. 3.6 - Prob. 19SECh. 3.6 - Prob. 20SECh. 3.7 - (a) Use Excel to make a scatter plot of the data...Ch. 3.7 - Prob. 22SECh. 3.7 - Prob. 23SECh. 3.7 - (a) Use Excel to make a scatter plot of the data,...Ch. 3 - Name two attractive features and two limitations...Ch. 3 - (a) What is a frequency distribution? (b) What are...Ch. 3 - (a) What is a histogram? (b) What does it show?Ch. 3 - (a) What is a bimodal histogram? (b) Explain the...Ch. 3 - (a) What is a scatter plot? (b) What do scatter...Ch. 3 - For what kind of data would we use a bar chart?...Ch. 3 - For what kind of data would we use a line chart?...Ch. 3 - (a) List the three most common types of charts in...Ch. 3 - (a) For what kind of data would we use a pie...Ch. 3 - Which types of charts can be used for time series...Ch. 3 - (a) When might we need a log scale? (b) What do...Ch. 3 - When might we use a stacked column chart? An area...Ch. 3 - List five deceptive graphical techniques.Ch. 3 - What is a pivot table? Why is it useful?Ch. 3 - The durations (minutes) of 26 electric power...Ch. 3 - The U.S. Postal Service will ship a Priority Mail,...Ch. 3 - A study of 40 U.S. cardiac care centers showed the...Ch. 3 - Prob. 28CECh. 3 - An executives telephone log showed the following...Ch. 3 - Below are batting averages of the New York Yankees...Ch. 3 - Prob. 31CECh. 3 - Prob. 32CECh. 3 - Download the full data set from the McGraw-Hill...Ch. 3 - (a) What kind of display is this? (b) Identify its...Ch. 3 - (a) What kind of display is this? (b) Identify its...Ch. 3 - (a) What kind of display is this? (b) Identify its...Ch. 3 - (a) What kind of display is this? (b) Identify its...Ch. 3 - Prob. 38CECh. 3 - (a) What kind of display is this? (b) Identify its...Ch. 3 - (a) What kind of display is this? (b) Identify its...Ch. 3 - Prob. 41CECh. 3 - Prob. 42CECh. 3 - (a) Use Excel to prepare an appropriate type of...Ch. 3 - Prob. 44CECh. 3 - Prob. 45CECh. 3 - (a) Use Excel to prepare an appropriate type of...Ch. 3 - Prob. 47CECh. 3 - (a) Use Excel to prepare an appropriate type of...
Knowledge Booster


Learn more about
Need a deep-dive on the concept behind this application? Look no further. Learn more about this topic, statistics and related others by exploring similar questions and additional content below.Similar questions
- A hair Salon uses 4 bottles of shampoo every 3 bottles of conditioner. The coordinate plane shows a graph of equipment ratios. Use the graph to find the number of bottles of conditioner that are used when 16 bottles of shampoo are used.arrow_forwardI need to graph the potato cubes and the class average weight change. My professor said the class average percent change would be the y axis and the Potato cubes is the x axis. How do I graph itarrow_forwardWhat is the domain, range, x-intercept, y-intercept, and slope of the attached table?arrow_forward
- Charlie will donate up to $500 to charity. The money will be divided between two charities: the City Youth Fund and the Educational Growth Foundation. Charlie would like the amount donated to the Educational Growth Foundation to be at least twice the amount donated to the City Youth Fund. Let x denote the amount of money (in dollars) donated to the City Youth Fund. Let y denote the amount of money (in dollars) donated to the Educational Growth Foundation. Shade the region corresponding to all values of x and y that satisfy these requirements. 5:20- 480- 440- 400- 360- 320- 280 240- 200- 160- 120- 80- 40- -120 -80 -40 -40- 80- -120 v 40 80 +8. +8.. +8.. 용+ to +å 120 160 200 240 280 320 360 400 440 480 520 X );)arrow_forwardRaquel earned $105 for baking seven pies one week. the following week she earned $90 for baking six pies. On the third week, she did not bake any pies or earned any money Use the coordinate grid below to create a line graph of your resultsarrow_forwardA grocery store sells sliced Swiss cheese by weight. The relationship between the amount of Swiss cheese in pounds, x, and the total cost in dollars of the sliced Swiss cheese, y, is represented by the graph below.arrow_forward
- 15) William uses the equation x2 + y² = 36 to represent the shape of a stone patio. %3D (a) Graph the equation on the accompanying grid. (b) What is the area of the stone patio to the nearest square unit?arrow_forwardPlot the following six points: (- 5,4) (1, 3) (– 2, – 1) (4,0) (2,– 3) (0,-2) 4. 2. -1arrow_forwardThe line plot shows the number of different colors that art students used in a colored-pencil sketch. How many art students used fewer than 7 colors?arrow_forward
arrow_back_ios
SEE MORE QUESTIONS
arrow_forward_ios
Recommended textbooks for you
 Glencoe Algebra 1, Student Edition, 9780079039897...AlgebraISBN:9780079039897Author:CarterPublisher:McGraw Hill
 Algebra: Structure And Method, Book 1AlgebraISBN:9780395977224Author:Richard G. Brown, Mary P. Dolciani, Robert H. Sorgenfrey, William L. ColePublisher:McDougal Littell
 Elementary AlgebraAlgebraISBN:9780998625713Author:Lynn Marecek, MaryAnne Anthony-SmithPublisher:OpenStax - Rice University

Glencoe Algebra 1, Student Edition, 9780079039897...
Algebra
ISBN:9780079039897
Author:Carter
Publisher:McGraw Hill
Algebra: Structure And Method, Book 1
Algebra
ISBN:9780395977224
Author:Richard G. Brown, Mary P. Dolciani, Robert H. Sorgenfrey, William L. Cole
Publisher:McDougal Littell
Elementary Algebra
Algebra
ISBN:9780998625713
Author:Lynn Marecek, MaryAnne Anthony-Smith
Publisher:OpenStax - Rice University
Inverse Functions; Author: Professor Dave Explains;https://www.youtube.com/watch?v=9fJsrnE1go0;License: Standard YouTube License, CC-BY