
Concept explainers
Videos
The table gives the US population from 1790 to 1860.
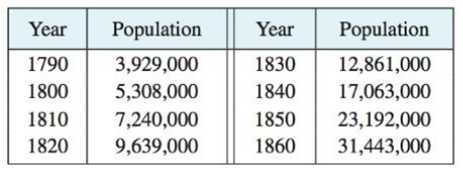
(a) Use a graphing calculator or computer to fit an exponential function to the data. Graph the data points and the exponential model. How good is the fit?
(b) Estimate the rates of population growth in 1800 and 1850 by averaging slopes of secant lines.
(c) Use the exponential model in part (a) to estimate the rates of growth in 1800 and 1850. Compare these estimates with the ones in part (b).
(d) Use the exponential model to predict the population in 1870. Compare with the actual population of 38,558,000. Can you explain the discrepancy?
(a)
To sketch: The given data points and the exponential model.
Explanation of Solution
The excel calculator is used to draw the given data points and the exponential model below as shown in Figure 1.
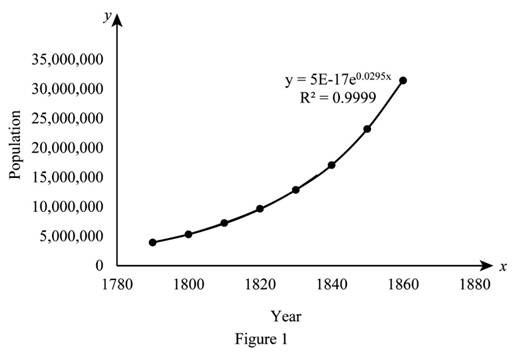
From Figure 1, it is observed that
Hence, the fit is good since
(b)
To estimate: The rates of population growth in 1800 and 1850 by averaging slopes of the secant lines.
Answer to Problem 78E
The average slope of the secant lines are
Explanation of Solution
Formula used:
The slope of a line at two points
Calculation:
Obtain the average slope of the secant line.
For 1800, the slope between 1790 to 1800 is computed as follows,
The slope between 1810 to 1800 is computed as follows,
The average slope of the secant line is,
Thus, the average slope of the secant line is,
For 1850, the slope between 1850 to 1840 is computed as follows,
For 1850, the slope between 1860 to 1850 is computed as follows,
The average slope of the secant line is,
Thus, the average slope of the secant line is
Therefore the average slope of the secant lines are
(c)
To estimate: The rate of growth in 1800 and 1850 by using part (a) and compare in part (b).
Answer to Problem 78E
The rate of growth in 1800 and 1850 are
Explanation of Solution
The derivative of the fit equation is
Substitute
Substitute
Therefore, the rate of growth in 1800 and 1850 are
(d)
To explain: The discrepancy between value of the exponential model to predict the population in 1870 and the actual population of 38,558,000.
Explanation of Solution
The value of the exponential model to predict the population in 1870 is given by 45,375,883 but the actual value is 38,558,000.
Thus, value of the exponential model to predict the population in 1870 is much larger than the actual value 38,558,000 because the model used is simplistic.
This model is basically assigns population to dates at 10 year intervals and used to predict a rough answer, but cannot predict with uncertainty
Chapter 3 Solutions
Single Variable Calculus: Concepts and Contexts, Enhanced Edition


 Calculus: Early TranscendentalsCalculusISBN:9781285741550Author:James StewartPublisher:Cengage Learning
 Thomas' Calculus (14th Edition)CalculusISBN:9780134438986Author:Joel R. Hass, Christopher E. Heil, Maurice D. WeirPublisher:PEARSON
 Calculus: Early Transcendentals (3rd Edition)CalculusISBN:9780134763644Author:William L. Briggs, Lyle Cochran, Bernard Gillett, Eric SchulzPublisher:PEARSON
 Calculus: Early TranscendentalsCalculusISBN:9781319050740Author:Jon Rogawski, Colin Adams, Robert FranzosaPublisher:W. H. Freeman
 Calculus: Early Transcendental FunctionsCalculusISBN:9781337552516Author:Ron Larson, Bruce H. EdwardsPublisher:Cengage Learning