
Statistical Reasoning for Everyday Life (5th Edition)
5th Edition
ISBN: 9780134494043
Author: Jeff Bennett, William L. Briggs, Mario F. Triola
Publisher: PEARSON
expand_more
expand_more
format_list_bulleted
Concept explainers
Videos
Textbook Question
Chapter 3.4, Problem 21E
Constant Dollars. The graph in Figure 3.41 shows the federal minimum wage in the United States, together with its purchasing power, which is adjusted for inflation, with 1996 used as the reference year. The graph represents the years from 1955 to 2015. Summarize what the graph shows.
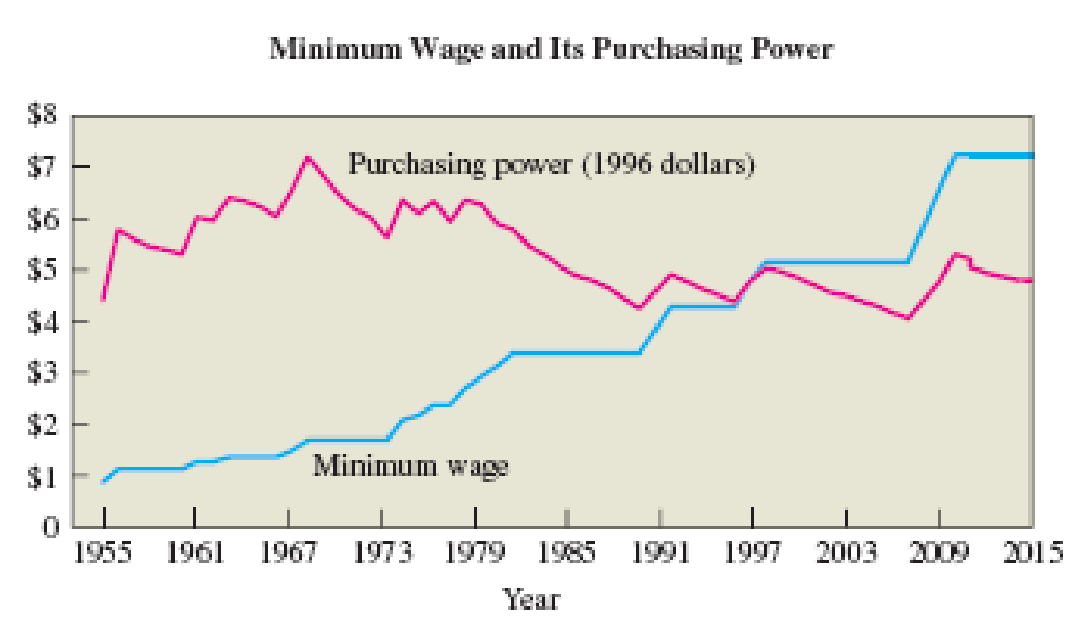
Figure 3.41
Source: U.S Census Bureau
Expert Solution & Answer
Want to see the full answer?
Check out a sample textbook solution
Students have asked these similar questions
Total spending on health care in a certain region rose from $881 million in 1977 to $941 billion in 2007. Compare this rise in health care spending to the overall rate of
inflation as measured by the Consumer Price Index.
Click the icon to view the Average Annual Consumer Price Index.
Health care spending increased by %.
(Round to the nearest percent as needed.)
Average Annual Consumer Price Index (1982-1984-100
Year
CPI
Year
CPI
Year
CPI
1976
56.9
1987
113.6
1998
163.0
166.6
1977
60.6
1988
118.3
1999
1978
65.2
1989
124.0
2000
172.2
130.7
136.2
2001
2002
1979
72.6
1990
177.1
1980
1981
82.4
1991
179.9
140.3
2003
2004
90.9
1992
184.0
144.5
148.2
188.9
195.3
201.6
1982
96.5
1993
99.6
103.9
2005
2006
1983
1994
1984
1995
152.4
2007 207.3
2008
215.3
1996
156.9
107.6
109.6
1985
1986
1997
160.5
Print
Done
Enter your answer in the answer box and then click Check Answer.
Use the graph below to answer the question.
Cost per Gallon
What was a likely result of the trend shown in the graph?
Construction of highways decreased.
Demand for public transportation declined.
U.S. consumers bought fewer fuel efficient cars.
O U.S. consumers had less money to spend on goods.
Annual Gas Prices 1978-1982
3.50
3.00
2.50
2.00
1.50
1.00
0.50
0.00
T
1978 1979 1980 1981 1982
Year
Source: Department of Energy
Suppose admission to a movie cost $7.50 in 2005. What
was its price in 1979 dollars? Assume that all prices have
risen at the same rate as the CPI.
The price was about $ in 1979.
(Round to the nearest cent.)
Average Annual Consumer Price Index (CPI) (1982-
1984=100)
Year
CPI Year CPI
Year CPI
1976 56.9
1989 124.0
2001 177.1
1977 60.6 1990 130.7
2002
179.9
2003
184.0
1978 65.2 1991 136.2
1992
1979
72.6
140.3
2004
188.9
1980
82.4
1993 144.5
2005
90.9 1994 148.2 2006
2007
1981
1982 96.5
1983 99.6
1984 103.9
1985 107.6
1995 152.4
1996 156.9
2008
1997 160.5
2009
1998 163.0
2010
1986 109.6 1999 166.6
2011
1987
113.6 2000 172.2
2012
1988
118.3
195.3
201.6
207.3
215.3
214.5
218.1
224.9
229.6
Chapter 3 Solutions
Statistical Reasoning for Everyday Life (5th Edition)
Ch. 3.1 - Frequency Table. What is a frequency table? How...Ch. 3.1 - Relative Frequency. What do we mean by relative...Ch. 3.1 - Cumulative Frequency. What do we mean by...Ch. 3.1 - Binning. What is the purpose of binning? Give an...Ch. 3.1 - Does It Make Sense? For Exercises 58, determine...Ch. 3.1 - Does It Make Sense? For Exercises 58, determine...Ch. 3.1 - Does It Make Sense? For Exercises 58, determine...Ch. 3.1 - Does It Make Sense? For Exercises 58, determine...Ch. 3.1 - Pulse Rates of Females. In Exercises 912, refer to...Ch. 3.1 - Pulse Rates of Females. In Exercises 912, refer to...
Ch. 3.1 - Pulse Rates of Females. In Exercises 912, refer to...Ch. 3.1 - Pulse Rates of Females. In Exercises 912, refer to...Ch. 3.1 - Birth Days. Births at a hospital in New York State...Ch. 3.1 - Clinical Trial. As part of a clinical trial, the...Ch. 3.1 - Train Derailments. An analysis of 50 train...Ch. 3.1 - Analysis of Last Digits. Weights of respondents...Ch. 3.1 - Academy Award-Winning Male Actors. The following...Ch. 3.1 - Body Temperatures. The following data show the...Ch. 3.1 - Loaded Die. An experiment was conducted in which a...Ch. 3.1 - Interpreting Family Data. Consider the following...Ch. 3.1 - Computer Keyboards. The traditional keyboard...Ch. 3.1 - Double Binning. The students in a statistics class...Ch. 3.2 - Distribution Graph. What is a distribution of...Ch. 3.2 - Qualitative Data. Which types of graph described...Ch. 3.2 - Yearly Data. Which type of graph described in this...Ch. 3.2 - Histogram and Stemplot. Assume that a data set is...Ch. 3.2 - Prob. 5ECh. 3.2 - Does It Make Sense? For Exercises 58, determine...Ch. 3.2 - Does It Make Sense? For Exercises 58, determine...Ch. 3.2 - Does It Make Sense? For Exercises 58, determine...Ch. 3.2 - Histogram. Children living near a smelter in Texas...Ch. 3.2 - Understanding Data. Suppose you have a list of...Ch. 3.2 - Most Appropriate Display. Exercises 1114 describe...Ch. 3.2 - Most Appropriate Display. Exercises 1114 describe...Ch. 3.2 - Most Appropriate Display. Exercises 1114 describe...Ch. 3.2 - Most Appropriate Display. Exercises 1114 describe...Ch. 3.2 - Academy Award-Winning Male Actors. Exercise 17 in...Ch. 3.2 - Body Temperatures. Exercise 18 in Section 3.1...Ch. 3.2 - Job Hunting. A survey was conducted to determine...Ch. 3.2 - Job Hunting. Refer to the data given in Exercise...Ch. 3.2 - Prob. 19ECh. 3.2 - Job Application Mistakes Construct a Pareto chart...Ch. 3.2 - Dotplot. Refer to the QWERTY data in Exercise 21...Ch. 3.2 - Dotplot. Refer to the Dvorak data in Exercise 21...Ch. 3.2 - Stemplot. Construct a stemplot of these test...Ch. 3.2 - Stemplot. Listed below are the lengths (in...Ch. 3.2 - DJIA. Listed below (in order by row) are annual...Ch. 3.2 - Home Runs. Listed below (in order by row) are the...Ch. 3.3 - Multiple Data. Briefly describe how each of the...Ch. 3.3 - Prob. 2ECh. 3.3 - Prob. 3ECh. 3.3 - Prob. 4ECh. 3.3 - Does It Make Sense? For Exercises 58, determine...Ch. 3.3 - Does It Make Sense? For Exercises 58, determine...Ch. 3.3 - Does It Make Sense? For Exercises 58, determine...Ch. 3.3 - Does It Make Sense? For Exercises 58, determine...Ch. 3.3 - Public and Private Colleges. The stack plot in...Ch. 3.3 - Home Prices by Region. The graph in Figure 3.21...Ch. 3.3 - Gender and Salary. Consider the display in Figure...Ch. 3.3 - Marriage and Divorce Rates. The graph in Figure...Ch. 3.3 - Prob. 13ECh. 3.3 - College Degrees. The stack plot in Figure 3.25...Ch. 3.3 - Contour Map. For Exercises 17 and 18, refer to the...Ch. 3.3 - Prob. 18ECh. 3.3 - Prob. 19ECh. 3.3 - Prob. 20ECh. 3.3 - Infographic. For Exercises 21 and 22, refer to...Ch. 3.3 - Infographic. For Exercises 21 and 22, refer to...Ch. 3.3 - Creating Graphics. Exercises 2326 give tables of...Ch. 3.3 - Creating Graphics. Exercises 2326 give tables of...Ch. 3.3 - Firearms Fatalities. The following table...Ch. 3.3 - Prob. 26ECh. 3.4 - Perceptual Distortion. Use a ruler to measure the...Ch. 3.4 - Prob. 2ECh. 3.4 - Prob. 3ECh. 3.4 - Prob. 4ECh. 3.4 - Does It Make Sense? For Exercises 58, determine...Ch. 3.4 - Does It Make Sense? For Exercises 58, determine...Ch. 3.4 - Does It Make Sense? For Exercises 58, determine...Ch. 3.4 - Does It Make Sense? For Exercises 58, determine...Ch. 3.4 - Exaggerating a Difference. Weekly instruction time...Ch. 3.4 - Graph of Sounds. In a survey conducted by Kelton...Ch. 3.4 - Graph Dimensions. A newspaper used images of...Ch. 3.4 - Prob. 12ECh. 3.4 - Prob. 13ECh. 3.4 - DJIA. Figure 3.36 on the next page depicts the...Ch. 3.4 - Prob. 15ECh. 3.4 - Prob. 16ECh. 3.4 - Prob. 17ECh. 3.4 - Moores Law. In 1965, Intel cofounder Gordon Moore...Ch. 3.4 - Prob. 19ECh. 3.4 - Prob. 20ECh. 3.4 - Constant Dollars. The graph in Figure 3.41 shows...Ch. 3.4 - Prob. 22ECh. 3 - Listed below are measured weights (in pounds) of...Ch. 3 - Listed below are measured weights (in pounds) of...Ch. 3 - Listed below are measured weights (in pounds) of...Ch. 3 - Pie Chart for Sports Equipment. USA Today reported...Ch. 3 - Pareto Chart for Sports Equipment. Construct a...Ch. 3 - Bar Chart. Figure 3.43 shows the numbers of U.S....Ch. 3 - As a quality control manager at Ford Motor...Ch. 3 - As a quality control manager at Ford, you monitor...Ch. 3 - A stemplot is created with the braking distances...Ch. 3 - A dotplot of braking distances (in feet) of cars...Ch. 3 - The first category in a frequency table is 90100,...Ch. 3 - The first category in a relative frequency table...Ch. 3 - The third category in a frequency table has a...Ch. 3 - Prob. 8CQCh. 3 - When constructing a graph of the same categorical...Ch. 3 - Body Temperatures Listed below are body...Ch. 3 - Why are pictographs generally poor for depicting...Ch. 3 - Note that this graph plots six variables: two...Ch. 3 - Prob. 2.2FCh. 3 - Prob. 2.3F
Knowledge Booster


Learn more about
Need a deep-dive on the concept behind this application? Look no further. Learn more about this topic, statistics and related others by exploring similar questions and additional content below.Similar questions
- Table 6 shows the year and the number ofpeople unemployed in a particular city for several years. Determine whether the trend appears linear. If so, and assuming the trend continues, in what year will the number of unemployed reach 5 people?arrow_forwardsam and ava compared the weights of their puppies each month during the first half of 2015. The graphs generated from this data are shown belowarrow_forwardThe following chart shows "living wage" jobs in Rochester per 1000 working age adults over a 5 year period. Year 2016 2017 2018 2019 2020 Jobs 650 705 750 785 805 What is the average rate of change in the number of living wage jobs from 2016 to 2018? Jobs/Year What is the average rate of change in the number of living wage jobs from 2018 to 2020? Jobs/Year Question Help: Video Message instructor Submit Questionarrow_forward
- The table below shows a recent graduate's credit card balance each month after graduation. Month 1 2 3 4 5 6 7 8 Debt ($) 620.00 761.88 899.80 1039.93 1270.63 1589.04 1851.31 2154.92 a) Look at the graph on your calculator. Based on this graph, what type of equation should represent this situation? Explain your answer. b) Use your calculator to find the equation that you feel best fits this data. What is the equation? c) Based on this equation, what is the predicted amount of debt for month 9 after graduation? View keyboard shortcuts EditViewInsertFormatToolsTable 12pt Paragrapharrow_forwardThe table below shows a recent graduate's credit card balance each month after graduation. Month 1 2 3 4 5 6 7 8 Debt ($) 620.00 761.88 899.80 1039.93 1270.63 1589.04 1851.31 2154.92 a) Look at the graph on your calculator. Based on this graph, what type of equation should represent this situation? Explain your answer. b) Use your calculator to find the equation that you feel best fits this data. What is the equation? c) Based on this equation, what is the predicted amount of debt for month 9 after graduation?arrow_forwardFind the simple interest balance function and the annual interest rate for the following partially listed balance table. Years, t Balance, B(t) 9 $1146.32 15 $1317.20 % Round the starting value to the nearest dollar. Input the number without the dollar sign. Example: 112 Round the slope to the nearest penny. Input only the number. Example 12.35 Round the annual interest rate to the nearest tenth of a percent. Input only the number. Example: 7.9arrow_forward
- Suppose you needed $25,000 to maintain a particular standard of living in 1979. How much would you have needed in 2004 to maintain the same standard of living? Assume that all prices have risen at the same rate as the CPI. How much would you have needed? (Round to the nearest dollar.) Average Annual Consumer Price Index (CPI) (1982-1984-100) Year CPI Year CPI Year CPI 1973 44.4 1984 103.9 1995 152.4 1974 49.3 1985 107.6 1996 156.9 1975 53.8 1986 109.6 1997 160.5 1976 56.9 1987 113.6 1998 163.0 1977 60.6 1988 118.3 1999 166.6 1978 65.2 1979 72.6 1989 124.0 2000 172.2 1990 130.7 2001 177.1 1980 82.4 1991 136.2 2002 179.9 1981 90.9 1992 140.3 2003 184.0 1982 96.5 1993 144.5 2004 188.9 1983 99.6 1994 148.2 2005 195.3arrow_forwardA teller's hourly wage for various years is represented in the table below. Year Hourly Wage 2015 $22.50 2016 $24.00 2017 $27.60 What was the hourly wage percent of change from 2016 to 2017? Be sure to state if it was a percent increase or percent decrease. %arrow_forward
arrow_back_ios
arrow_forward_ios
Recommended textbooks for you
 College AlgebraAlgebraISBN:9781305115545Author:James Stewart, Lothar Redlin, Saleem WatsonPublisher:Cengage Learning
 Calculus For The Life SciencesCalculusISBN:9780321964038Author:GREENWELL, Raymond N., RITCHEY, Nathan P., Lial, Margaret L.Publisher:Pearson Addison Wesley,
 Glencoe Algebra 1, Student Edition, 9780079039897...AlgebraISBN:9780079039897Author:CarterPublisher:McGraw Hill
College Algebra
Algebra
ISBN:9781305115545
Author:James Stewart, Lothar Redlin, Saleem Watson
Publisher:Cengage Learning
Calculus For The Life Sciences
Calculus
ISBN:9780321964038
Author:GREENWELL, Raymond N., RITCHEY, Nathan P., Lial, Margaret L.
Publisher:Pearson Addison Wesley,
Glencoe Algebra 1, Student Edition, 9780079039897...
Algebra
ISBN:9780079039897
Author:Carter
Publisher:McGraw Hill
Use of ALGEBRA in REAL LIFE; Author: Fast and Easy Maths !;https://www.youtube.com/watch?v=9_PbWFpvkDc;License: Standard YouTube License, CC-BY
Compound Interest Formula Explained, Investment, Monthly & Continuously, Word Problems, Algebra; Author: The Organic Chemistry Tutor;https://www.youtube.com/watch?v=P182Abv3fOk;License: Standard YouTube License, CC-BY
Applications of Algebra (Digit, Age, Work, Clock, Mixture and Rate Problems); Author: EngineerProf PH;https://www.youtube.com/watch?v=Y8aJ_wYCS2g;License: Standard YouTube License, CC-BY