
a)
Correctly labeled graph that shows a short-run
a)
Explanation of Solution
The graph shows a short-run Phillips curve with an expected inflation rate of 0% along with long-run Phillips curve as:
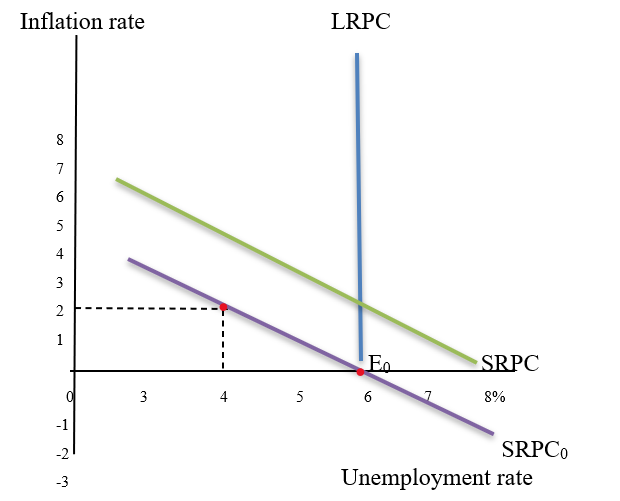
The graph illustrates the inflation rate on the vertical axis and shows the real
The long-run Phillips Curve is represented in a vertical line by labeling it LRPC as in the long run, there would not be a trade-off between unemployment and inflation because unemployment returns, in the long run, would remain stable to the natural rate but the inflation rate would reach its higher level.
And, new SRPC is labeled SRPC1 which is above the original or old SRPC.
Introduction: Inflation means there is an increase in the price of goods and services in the economy which affects the consumption level of the people in the country. And unemployment is the rate of unemployed people who do not have any work or source to employ in the economy. The Philips curve represents that there is a negative or inverse relationship or trade-off between these two factors (inflation and unemployment) in the short run.
b)
Labeling point of a nonaccelerating inflation rate of unemployment
b)
Explanation of Solution
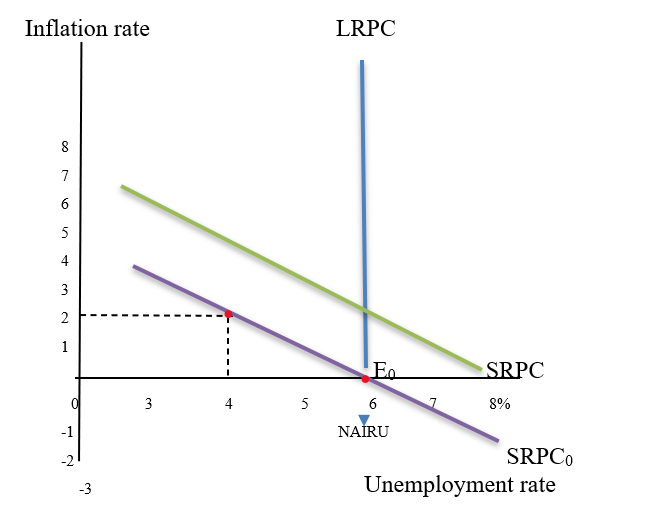
The NAIRU is the lowest level of unemployment that can be maintained without raising inflation and wage growth.
By considering it on the graph, there is a downward slope of the short-run Phillips Curve which is labeled by SRPC0 and it crosses the horizontal axis by intercepting LRPC which is the point of NAIRU.
And, new SRPC is labeled SRPC1 which is above the original or old SRPC.
On the graph, the NAIRU point will be shown as:
Introduction: Inflation means there is an increase in the price of goods and services in the economy which affects the consumption level of the people in the country. And unemployment is the rate of unemployed people who do not have any work or source to employ in the economy. The Philips curve represents that there is a negative or inverse relationship or trade-off between these two factors (inflation and unemployment) in the short run.
c)
What happens when the government decides to decrease the unemployment rate below the nonaccelerating inflation rate of unemployment in the long-run
c)
Explanation of Solution
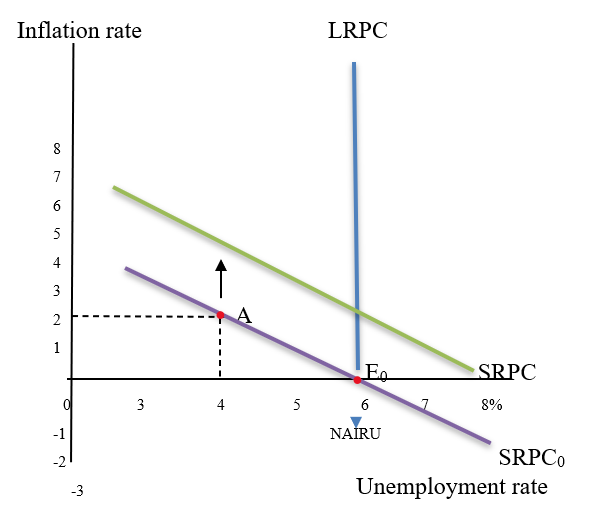
The graph shows that when the unemployment rate shifts below the point of NAIRU by the government (nonaccelerated inflation rate and unemployment rate) then, it creates inflation and shifts the economy to point A in the graph. It means there are positive inflationary expectations that are responsible to shift the short-run Phillips curve to the up which is labeled by SRPC1.
Now, the graph would be represented as:
Introduction: Inflation means there is an increase in the price of goods and services in the economy which affects the consumption level of the people in the country. And unemployment is the rate of unemployed people who do not have any work or source to employ in the economy. The Philips curve represents that there is a negative or inverse relationship or trade-off between these two factors (inflation and unemployment) in the short run.
Chapter 34 Solutions
Krugman's Economics For The Ap® Course


 Principles of Economics (12th Edition)EconomicsISBN:9780134078779Author:Karl E. Case, Ray C. Fair, Sharon E. OsterPublisher:PEARSON
 Engineering Economy (17th Edition)EconomicsISBN:9780134870069Author:William G. Sullivan, Elin M. Wicks, C. Patrick KoellingPublisher:PEARSON
 Principles of Economics (MindTap Course List)EconomicsISBN:9781305585126Author:N. Gregory MankiwPublisher:Cengage Learning
 Managerial Economics: A Problem Solving ApproachEconomicsISBN:9781337106665Author:Luke M. Froeb, Brian T. McCann, Michael R. Ward, Mike ShorPublisher:Cengage Learning
 Managerial Economics & Business Strategy (Mcgraw-...EconomicsISBN:9781259290619Author:Michael Baye, Jeff PrincePublisher:McGraw-Hill Education