Concept explainers
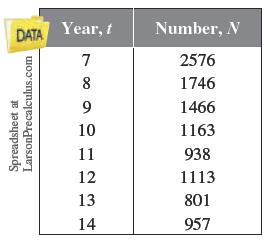
Lyme Disease
The numbers


(a) Use a graphing utility to create a
(b) Use the regression feature of the graphing utility to find a quartic model for the data. (A quartic model has the form
(c) Use the model to create a table of estimated values of
(d) Use synthetic division to confirm algebraically your estimated value for the year 2014.
Want to see the full answer?
Check out a sample textbook solution
Chapter 3 Solutions
College Algebra
- 3. Let M = (a) - (b) 2 −1 1 -1 2 7 4 -22 Find a basis for Col(M). Find a basis for Null(M).arrow_forwardSchoology X 1. IXL-Write a system of X Project Check #5 | Schx Thomas Edison essay, x Untitled presentation ixl.com/math/algebra-1/write-a-system-of-equations-given-a-graph d.net bookmarks Play Gimkit! - Enter... Imported Imported (1) Thomas Edison Inv... ◄›) What system of equations does the graph show? -8 -6 -4 -2 y 8 LO 6 4 2 -2 -4 -6 -8. 2 4 6 8 Write the equations in slope-intercept form. Simplify any fractions. y = y = = 00 S olo 20arrow_forwardEXERCICE 2: 6.5 points Le plan complexe est rapporté à un repère orthonormé (O, u, v ).Soit [0,[. 1/a. Résoudre dans l'équation (E₁): z2-2z+2 = 0. Ecrire les solutions sous forme exponentielle. I b. En déduire les solutions de l'équation (E2): z6-2 z³ + 2 = 0. 1-2 2/ Résoudre dans C l'équation (E): z² - 2z+1+e2i0 = 0. Ecrire les solutions sous forme exponentielle. 3/ On considère les points A, B et C d'affixes respectives: ZA = 1 + ie 10, zB = 1-ie 10 et zc = 2. a. Déterminer l'ensemble EA décrit par le point A lorsque e varie sur [0, 1. b. Calculer l'affixe du milieu K du segment [AB]. C. Déduire l'ensemble EB décrit par le point B lorsque varie sur [0,¹ [. d. Montrer que OACB est un parallelogramme. e. Donner une mesure de l'angle orienté (OA, OB) puis déterminer pour que OACB soit un carré.arrow_forward
- 2 Use grouping to factor: 10x + 13x + 3 = 0 Identify A B and C in the chart below feach responce inarrow_forward2 Use grouping to factor: 10x² + 13x + 3 = 0 Identify A, B, and C in the chart below. (each rearrow_forward2 Use grouping to factor: 10x + 13x + 3 = 0 Identify A B and C in the chart below feach responce inarrow_forward
- Use grouping to fully factor: x³ + 3x² - 16x - 48 = 0 3 2arrow_forwardName: Tay Jones Level Two Date: Algebra 3 Unit 3: Functions and Equations Practice Assessment Class: #7-OneNote 1. The function f(x) = x² is transformed in the following functions. List the vertex for each function, circle whether the function opens up or down, and why. All three parts must be correct to receive Level 2 points. You can receive points for a, b, and c. a) g(x) = -2(x+5)² Vertex: Opens Up Opens Down Why? ais negative -2 Vertex: b) g(x) = (x + 2)² - 3 c) g(x) = -4(x + 2)² + 2 Opens Up Opens Down Vertex: Opens Up Opens Down Why? 4 Ca is negative) Why? his positive 2. The graph of the function f(x) is shown below. Find the domain, range, and end behavior. Then list the values of x for which the function values are increasing and decreasing. f(x) Domain: End Behavior: As x → ∞o, f(x) -> -6 As x, f(x) -> Range: Where is it Increasing? (002] Where is it Decreasing? (1,00)arrow_forwardShow what to do on the graph visually please!arrow_forward
- The county's new asphalt paving machine can surface 1 km of highway in 10 h. A much older machine can surface 1 km in 18 h. How long will it take them to surface 21 km of highway if they start at opposite ends and work day and night?arrow_forward3. Write a system of linear equations in slope intercept form that has exactly one solution at the point (3, 4), such that one line has positive slope (but not 1) and the other line has negative slope (but not "1). Also write your system of equations with both equations written in standard form with out any fractions 8- 7 8 5 4 3 -2- + -8-7-6-5-4-3-2-1 1 2 3 -1 2 - ° 4 -5 - -8arrow_forward2. Write a system of linear equations in slope-intercept form has exactly one solution at the point (3, 4), such that both lines have negative slope (but neither one has slope of 1). Also write your system of equations with both equations written in standard form without any fractions. B 0 5 4 3 -2 1 -8-7-6-5-4-3-2 -1 12 3 -1 2 -3 -5 6 -7 -8arrow_forward
- Algebra & Trigonometry with Analytic GeometryAlgebraISBN:9781133382119Author:SwokowskiPublisher:Cengage
 Elementary Linear Algebra (MindTap Course List)AlgebraISBN:9781305658004Author:Ron LarsonPublisher:Cengage Learning
 College Algebra (MindTap Course List)AlgebraISBN:9781305652231Author:R. David Gustafson, Jeff HughesPublisher:Cengage Learning


