
The correctly labeled aggregate demand and
Explanation of Solution
The graph shows long-run macroeconomic equilibrium:
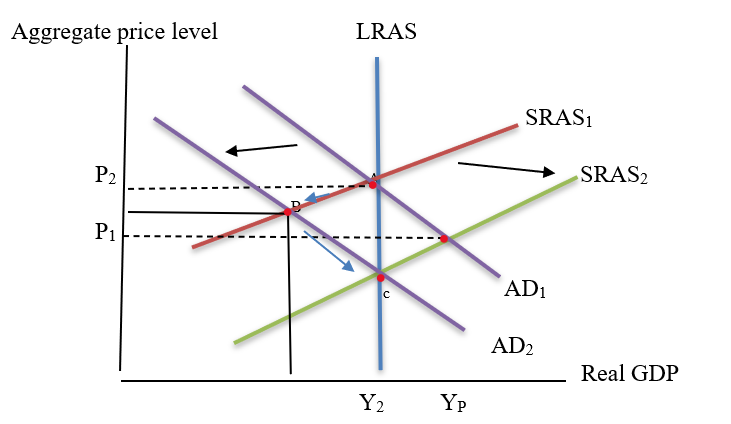
The graph illustrates the long-run macroeconomic equilibrium by labeling the aggregate
Long-run equilibrium is an equilibrium that occurs at a point on the long-run
The investment will decrease the aggregate demand due to recession in the long run. Therefore, the aggregate demand would shift to the left.
The graph also indicates that there is an increase in money supply because the supply curve shifts to the right as there would be lower interest rates under the classical model of the price level. Here the classical model of price indicates that the economy is flowing freely and prices can be adjusted according to the ups and downs in the economy such as in good economic conditions, prices will go up.
Introduction: An aggregate supply refers to the total supply of goods and services at different price levels (aggregated) in the economy. In simple words, it is the total quantity that is produced and sold by firms at different prices in the market.
The price level is the average current price of goods and services in the economy that are produced in a particular interval.
Chapter 33 Solutions
Krugman's Economics For The Ap® Course


 Principles of Economics (12th Edition)EconomicsISBN:9780134078779Author:Karl E. Case, Ray C. Fair, Sharon E. OsterPublisher:PEARSON
 Engineering Economy (17th Edition)EconomicsISBN:9780134870069Author:William G. Sullivan, Elin M. Wicks, C. Patrick KoellingPublisher:PEARSON
 Principles of Economics (MindTap Course List)EconomicsISBN:9781305585126Author:N. Gregory MankiwPublisher:Cengage Learning
 Managerial Economics: A Problem Solving ApproachEconomicsISBN:9781337106665Author:Luke M. Froeb, Brian T. McCann, Michael R. Ward, Mike ShorPublisher:Cengage Learning
 Managerial Economics & Business Strategy (Mcgraw-...EconomicsISBN:9781259290619Author:Michael Baye, Jeff PrincePublisher:McGraw-Hill Education