
Calculus
11th Edition
ISBN: 9780357246412
Author: Ron Larson; Bruce H. Edwards
Publisher: Cengage Limited
expand_more
expand_more
format_list_bulleted
Videos
Textbook Question
Chapter 3.2, Problem 37E
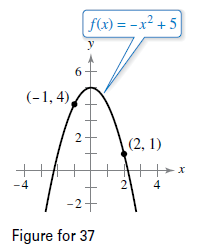
Mean Value Theorem Consider the graph of the function f(x)=−x2+5
(see figure).
(a) Find the equation of the secant line joining the points (−1,4) and (2, 1).
(b) Use the Mean Value Theorem to determine a point c in the interval (−1,2) such that the tangent line at c is parallel to the secant line.
(c) Find the equation of the tangent line through c.
(d) Use a graphing utility to graph f, the secant line, and the tangent line.
Expert Solution & Answer
Want to see the full answer?
Check out a sample textbook solution
Students have asked these similar questions
Find the tangent line approximation 7 to the graph of f at the given point.
T(x) =
f(x) = csc(x), (8, csc(8))
Complete the table. (Round your answers to four decimal places.)
x
f(x)
T(x)
7.9
7.99
8
8.01
8.1
Can you solve it numerical method
Use the information to find and compare Ay and dy. (Round your answers to four decimal places.)
Function
x-Value
Differential of x
Ду
=
dy
=
y = x² + 2
x = -4
Ax = dx = 0.01
Chapter 3 Solutions
Calculus
Ch. 3.1 - CONCEPT CHECK Minimum What does it mean to say...Ch. 3.1 - Prob. 2ECh. 3.1 - Prob. 3ECh. 3.1 - Prob. 4ECh. 3.1 - Prob. 5ECh. 3.1 - CONCEPT CHECK Extrema on a Closed Interval Explain...Ch. 3.1 - The Value of the Derivative at Relative Extrema In...Ch. 3.1 - The Value of the Derivative at Relative Extrema In...Ch. 3.1 - The Value of the Derivative at Relative Extrema In...Ch. 3.1 - The Value of the Derivative at Relative Extrema In...
Ch. 3.1 - The Value of the Derivative at Relative Extrema In...Ch. 3.1 - The Value of the Derivative at Relative Extrema In...Ch. 3.1 - Prob. 13ECh. 3.1 - Approximating Critical Numbers In Exercises 13-16,...Ch. 3.1 - Approximating Critical Numbers In Exercises 13-16,...Ch. 3.1 - Prob. 16ECh. 3.1 - Finding Critical Numbers In Exercises 17-22, find...Ch. 3.1 - Finding Critical Numbers In Exercises 17-22, find...Ch. 3.1 - Finding Critical Numbers In Exercises 17-22, find...Ch. 3.1 - Prob. 20ECh. 3.1 - Finding Critical Numbers In Exercises 17-22, find...Ch. 3.1 - Finding Critical Numbers In Exercises 17-22, find...Ch. 3.1 - Finding Extrema on a Closed Interval In Exercises...Ch. 3.1 - Prob. 24ECh. 3.1 - Finding Extrema on a Closed Interval In Exercises...Ch. 3.1 - Prob. 26ECh. 3.1 - Prob. 27ECh. 3.1 - Prob. 28ECh. 3.1 - Finding Extrema on a Closed Interval In Exercises...Ch. 3.1 - Finding Extrema on a Closed Interval In Exercises...Ch. 3.1 - Prob. 31ECh. 3.1 - Prob. 32ECh. 3.1 - Prob. 33ECh. 3.1 - Prob. 34ECh. 3.1 - Prob. 35ECh. 3.1 - Prob. 36ECh. 3.1 - Prob. 37ECh. 3.1 - Finding Extrema on a Closed Interval In Exercises...Ch. 3.1 - Prob. 39ECh. 3.1 - Finding Extrema on a Closed Interval In Exercises...Ch. 3.1 - Finding Extrema on an Interval In Exercises 41-44,...Ch. 3.1 - Prob. 42ECh. 3.1 - Finding Extrema on an Interval In Exercises 41-44,...Ch. 3.1 - Finding Extrema on an Interval In Exercises 41-44,...Ch. 3.1 - Finding Absolute Extrema Using Technology In...Ch. 3.1 - Prob. 46ECh. 3.1 - Prob. 47ECh. 3.1 - Prob. 48ECh. 3.1 - Prob. 49ECh. 3.1 - Prob. 50ECh. 3.1 - Prob. 51ECh. 3.1 - Prob. 52ECh. 3.1 - Prob. 53ECh. 3.1 - Finding Maximum Values Using Technology In...Ch. 3.1 - Writing Write a short paragraph explaining why a...Ch. 3.1 - HOW DO YOU SEE IT? Determine whether each labeled...Ch. 3.1 - Using Graphs In Exercises 57 and 58, determine...Ch. 3.1 - Using Graphs In Exercises 57 and 58, determine...Ch. 3.1 - Prob. 59ECh. 3.1 - Prob. 60ECh. 3.1 - Power The formula for the power output P of a...Ch. 3.1 - Lawn Sprinkler A lawn spunkier is constructed in...Ch. 3.1 - Honeycomb The surface area of a cell in a...Ch. 3.1 - Highway Design In order to build a highway, it is...Ch. 3.1 - Prob. 65ECh. 3.1 - Prob. 66ECh. 3.1 - Prob. 67ECh. 3.1 - Prob. 68ECh. 3.1 - Functions Lei the function f be differentiable on...Ch. 3.1 - Prob. 70ECh. 3.1 - Determine all real numbers a0 for which there...Ch. 3.2 - Rolle's Theorem In your own words, describe Rolles...Ch. 3.2 - Prob. 2ECh. 3.2 - Writing In Exercises 3-6, explain why Rolles...Ch. 3.2 - Prob. 4ECh. 3.2 - Prob. 5ECh. 3.2 - Writing In Exercises 3-6, explain why Rolles...Ch. 3.2 - Prob. 7ECh. 3.2 - Using Rolles Theorem In Exercises 7-10, find the...Ch. 3.2 - Prob. 9ECh. 3.2 - Prob. 10ECh. 3.2 - Using Rolle's Theorem In Exercises 11-24,...Ch. 3.2 - Prob. 12ECh. 3.2 - Using Rolle's Theorem In Exercises 11-24,...Ch. 3.2 - Prob. 14ECh. 3.2 - Prob. 15ECh. 3.2 - Using Rolle's Theorem In Exercises 11-24,...Ch. 3.2 - Prob. 17ECh. 3.2 - Prob. 18ECh. 3.2 - Prob. 19ECh. 3.2 - Prob. 20ECh. 3.2 - Prob. 21ECh. 3.2 - Prob. 22ECh. 3.2 - Prob. 23ECh. 3.2 - Using Rolle's Theorem In Exercises 11-24,...Ch. 3.2 - Prob. 25ECh. 3.2 - Prob. 26ECh. 3.2 - Prob. 27ECh. 3.2 - Prob. 28ECh. 3.2 - Prob. 29ECh. 3.2 - Reorder Costs The ordering and transportation cost...Ch. 3.2 - Prob. 31ECh. 3.2 - Prob. 32ECh. 3.2 - Prob. 33ECh. 3.2 - Writing In Exercises 3336, explain why the Mean...Ch. 3.2 - Prob. 35ECh. 3.2 - Prob. 36ECh. 3.2 - Mean Value Theorem Consider the graph of the...Ch. 3.2 - Mean Value Theorem Consider the graph of the...Ch. 3.2 - Prob. 39ECh. 3.2 - Prob. 40ECh. 3.2 - Prob. 41ECh. 3.2 - Prob. 42ECh. 3.2 - Prob. 43ECh. 3.2 - Prob. 44ECh. 3.2 - Prob. 45ECh. 3.2 - Prob. 46ECh. 3.2 - Prob. 47ECh. 3.2 - Prob. 48ECh. 3.2 - Prob. 49ECh. 3.2 - Prob. 51ECh. 3.2 - Prob. 50ECh. 3.2 - Using the Mean Value Theorem In Exercises 49-52,...Ch. 3.2 - Prob. 53ECh. 3.2 - Sales A company introduces a new product for which...Ch. 3.2 - EXPLORING CONCEPTS Converse of Rolles Theorem Let...Ch. 3.2 - Prob. 56ECh. 3.2 - Prob. 57ECh. 3.2 - Prob. 58ECh. 3.2 - Prob. 59ECh. 3.2 - Temperature When an object is removed from a...Ch. 3.2 - Velocity Two bicyclists begin a race at 8:00 a.m....Ch. 3.2 - Prob. 62ECh. 3.2 - Prob. 63ECh. 3.2 - Prob. 64ECh. 3.2 - Prob. 65ECh. 3.2 - Prob. 66ECh. 3.2 - Prob. 67ECh. 3.2 - Prob. 68ECh. 3.2 - Prob. 69ECh. 3.2 - Prob. 70ECh. 3.2 - Prob. 71ECh. 3.2 - Prob. 72ECh. 3.2 - Prob. 73ECh. 3.2 - Prob. 74ECh. 3.2 - Prob. 75ECh. 3.2 - Prob. 76ECh. 3.2 - Prob. 77ECh. 3.2 - Proof Prove that if f(x)=0 for all x in an...Ch. 3.2 - Prob. 79ECh. 3.2 - Prob. 80ECh. 3.2 - Prob. 81ECh. 3.2 - Prob. 82ECh. 3.2 - Prob. 83ECh. 3.2 - Prob. 84ECh. 3.2 - Using the Mean Value Theorem Let 0ab. Use the Mean...Ch. 3.3 - CONCEPT CHECK Increasing and Decreasing Functions...Ch. 3.3 - Prob. 2ECh. 3.3 - Prob. 3ECh. 3.3 - Using a Graph In Exercises 3 and 4, use the graph...Ch. 3.3 - Prob. 5ECh. 3.3 - Prob. 6ECh. 3.3 - Prob. 7ECh. 3.3 - Prob. 8ECh. 3.3 - Prob. 9ECh. 3.3 - Using a Graph In Exercises 5-10, use graph to...Ch. 3.3 - Prob. 11ECh. 3.3 - Prob. 12ECh. 3.3 - Prob. 13ECh. 3.3 - Prob. 14ECh. 3.3 - Prob. 15ECh. 3.3 - Intervals on Which a Function Is Increasing or...Ch. 3.3 - Intervals on Which a Function Is Increasing or...Ch. 3.3 - Intervals on Which a Function Is Increasing or...Ch. 3.3 - Prob. 19ECh. 3.3 - Prob. 20ECh. 3.3 - Prob. 21ECh. 3.3 - Prob. 22ECh. 3.3 - Applying the First Derivative Test In Exercises...Ch. 3.3 - Applying the First Derivative Test In Exercises...Ch. 3.3 - Prob. 25ECh. 3.3 - Applying the First Derivative Test In Exercises...Ch. 3.3 - Prob. 27ECh. 3.3 - Prob. 28ECh. 3.3 - Applying the First Derivative Test In Exercises...Ch. 3.3 - Applying the First Derivative Test In Exercises...Ch. 3.3 - Prob. 31ECh. 3.3 - Prob. 32ECh. 3.3 - Prob. 33ECh. 3.3 - Applying the First Derivative Test In Exercises...Ch. 3.3 - Applying the First Derivative Test In Exercises...Ch. 3.3 - Applying the First Derivative Test In Exercises...Ch. 3.3 - Prob. 37ECh. 3.3 - Prob. 38ECh. 3.3 - Prob. 39ECh. 3.3 - Applying the First Derivative Test In Exercises...Ch. 3.3 - Prob. 41ECh. 3.3 - Applying the First Derivative Test In Exercises...Ch. 3.3 - Applying the First Derivative Test In Exercises...Ch. 3.3 - Prob. 44ECh. 3.3 - Prob. 45ECh. 3.3 - Applying the First Derivative Test In Exercises...Ch. 3.3 - Applying the First Derivative Test In Exercises...Ch. 3.3 - Prob. 48ECh. 3.3 - Prob. 49ECh. 3.3 - Finding and Analyzing Derivatives Using Technology...Ch. 3.3 - Prob. 51ECh. 3.3 - Prob. 52ECh. 3.3 - Prob. 53ECh. 3.3 - Prob. 54ECh. 3.3 - Prob. 55ECh. 3.3 - Prob. 56ECh. 3.3 - Think About It In Exercises 57-62, the graph of f...Ch. 3.3 - Think About It In Exercises 57-62, the graph of f...Ch. 3.3 - Think About It In Exercises 57-62, the graph of f...Ch. 3.3 - Prob. 60ECh. 3.3 - Prob. 61ECh. 3.3 - Think About It In Exercises 57-62, the graph of f...Ch. 3.3 - EXPLORING CONCEPTS Transformations of Functions In...Ch. 3.3 - Prob. 64ECh. 3.3 - EXPLORING CONCEPTS Transformations of Functions In...Ch. 3.3 - Prob. 66ECh. 3.3 - Prob. 67ECh. 3.3 - Prob. 68ECh. 3.3 - Prob. 69ECh. 3.3 - HOW DO YOU SEE IT? Use the graph of f to (a)...Ch. 3.3 - Prob. 71ECh. 3.3 - Prob. 72ECh. 3.3 - Prob. 73ECh. 3.3 - Prob. 74ECh. 3.3 - Rolling a Ball Bearing A ball bearing is placed on...Ch. 3.3 - Prob. 76ECh. 3.3 - Prob. 77ECh. 3.3 - Prob. 78ECh. 3.3 - Trachea Contraction Coughing forces the trachea...Ch. 3.3 - Electrical Resistance The resistance R of a...Ch. 3.3 - Motion Along a Line In Exercises 81-84, the...Ch. 3.3 - Prob. 82ECh. 3.3 - Prob. 83ECh. 3.3 - Prob. 84ECh. 3.3 - Motion Along a Line In Exercises 85 and 86, the...Ch. 3.3 - Motion Along a Line In Exercises 85 and 86, the...Ch. 3.3 - Prob. 87ECh. 3.3 - Prob. 88ECh. 3.3 - Prob. 89ECh. 3.3 - Prob. 90ECh. 3.3 - Prob. 91ECh. 3.3 - Prob. 92ECh. 3.3 - Prob. 93ECh. 3.3 - Prob. 94ECh. 3.3 - Prob. 95ECh. 3.3 - Prob. 96ECh. 3.3 - Prob. 97ECh. 3.3 - Prob. 98ECh. 3.3 - Prob. 99ECh. 3.3 - Prob. 100ECh. 3.3 - PUTNAM EXAM CHALLENGE Find the minimum value of |...Ch. 3.4 - CONCEPT CHECK Test for Concavity Describe (he Test...Ch. 3.4 - Prob. 2ECh. 3.4 - Using a Graph In Exercises 3 and 4, the graph of f...Ch. 3.4 - Using a Graph In Exercises 3 and 4, the graph of f...Ch. 3.4 - Prob. 5ECh. 3.4 - Prob. 6ECh. 3.4 - Prob. 7ECh. 3.4 - Determining Concavity In Exercises 5-16, determine...Ch. 3.4 - Prob. 9ECh. 3.4 - Prob. 10ECh. 3.4 - Prob. 11ECh. 3.4 - Prob. 12ECh. 3.4 - Prob. 13ECh. 3.4 - Determining Concavity In Exercises 5-16, determine...Ch. 3.4 - Prob. 15ECh. 3.4 - Prob. 16ECh. 3.4 - Prob. 17ECh. 3.4 - Prob. 18ECh. 3.4 - Prob. 19ECh. 3.4 - Prob. 20ECh. 3.4 - Prob. 21ECh. 3.4 - Finding Points of Inflection In Exercises 17-32,...Ch. 3.4 - Prob. 23ECh. 3.4 - Prob. 24ECh. 3.4 - Prob. 25ECh. 3.4 - Prob. 26ECh. 3.4 - Prob. 27ECh. 3.4 - Prob. 28ECh. 3.4 - Finding Points of Inflection In Exercises 17-32,...Ch. 3.4 - Finding Points of Inflection In Exercises 17-32,...Ch. 3.4 - Finding Points of Inflection In Exercises 17-32,...Ch. 3.4 - Prob. 32ECh. 3.4 - Using the Second Derivative Test In Exercises...Ch. 3.4 - Using the Second Derivative Test In Exercises...Ch. 3.4 - Prob. 37ECh. 3.4 - Prob. 38ECh. 3.4 - Prob. 34ECh. 3.4 - Prob. 35ECh. 3.4 - Prob. 39ECh. 3.4 - Using the Second Derivative Test In Exercises...Ch. 3.4 - Prob. 41ECh. 3.4 - Prob. 42ECh. 3.4 - Prob. 43ECh. 3.4 - Prob. 44ECh. 3.4 - Prob. 45ECh. 3.4 - Prob. 46ECh. 3.4 - Prob. 47ECh. 3.4 - Prob. 48ECh. 3.4 - Prob. 49ECh. 3.4 - Prob. 50ECh. 3.4 - Prob. 51ECh. 3.4 - Sketching Graphs In Exercises 51 and 52, the graph...Ch. 3.4 - Prob. 53ECh. 3.4 - Prob. 54ECh. 3.4 - Prob. 55ECh. 3.4 - Think About It In Exercises 5356, sketch the graph...Ch. 3.4 - Prob. 57ECh. 3.4 - Prob. 58ECh. 3.4 - Prob. 59ECh. 3.4 - Prob. 60ECh. 3.4 - Prob. 61ECh. 3.4 - Finding a Cubic Function In Exercises 61 and 62,...Ch. 3.4 - Aircraft Glide Path A small aircraft starts its...Ch. 3.4 - Highway Design A section of highway connecting two...Ch. 3.4 - Prob. 65ECh. 3.4 - Prob. 66ECh. 3.4 - Prob. 67ECh. 3.4 - Modeling Data The average typing speeds S (in...Ch. 3.4 - Prob. 69ECh. 3.4 - Prob. 70ECh. 3.4 - Prob. 71ECh. 3.4 - Prob. 72ECh. 3.4 - Prob. 73ECh. 3.4 - Prob. 74ECh. 3.4 - True or False? In Exercises 75-78, determine...Ch. 3.4 - Prob. 76ECh. 3.4 - Prob. 77ECh. 3.4 - True or False? In Exercises 75-78., determine...Ch. 3.4 - Prob. 79ECh. 3.4 - Prob. 80ECh. 3.5 - Prob. 1ECh. 3.5 - Prob. 2ECh. 3.5 - Prob. 3ECh. 3.5 - Prob. 4ECh. 3.5 - Matching In Exercises 5-10, match the function...Ch. 3.5 - Matching In Exercises 5-10, match the function...Ch. 3.5 - Matching In Exercises 5-10, match the function...Ch. 3.5 - Matching In Exercises 5-10, match the function...Ch. 3.5 - Matching In Exercises 5-10, match the function...Ch. 3.5 - Matching In Exercises 5-10, match the function...Ch. 3.5 - Finding Limits at Infinity In Exercises 11 and 12,...Ch. 3.5 - Prob. 12ECh. 3.5 - Prob. 13ECh. 3.5 - Prob. 14ECh. 3.5 - Prob. 15ECh. 3.5 - Finding Limits at Infinity In Exercises 13-16,...Ch. 3.5 - Prob. 17ECh. 3.5 - Finding a Limit In Exercises 17-36, find the...Ch. 3.5 - Prob. 19ECh. 3.5 - Prob. 20ECh. 3.5 - Prob. 21ECh. 3.5 - Prob. 22ECh. 3.5 - Prob. 23ECh. 3.5 - Prob. 24ECh. 3.5 - Finding a Limit In Exercises 17-36, find the...Ch. 3.5 - Finding a Limit In Exercises 17-36, find the...Ch. 3.5 - Finding a Limit In Exercises 17-36, find the...Ch. 3.5 - Prob. 28ECh. 3.5 - Prob. 29ECh. 3.5 - Prob. 30ECh. 3.5 - Prob. 31ECh. 3.5 - Prob. 32ECh. 3.5 - Prob. 33ECh. 3.5 - Prob. 34ECh. 3.5 - Prob. 35ECh. 3.5 - Prob. 36ECh. 3.5 - Prob. 37ECh. 3.5 - Prob. 38ECh. 3.5 - Prob. 39ECh. 3.5 - Prob. 40ECh. 3.5 - Finding a Limit In Exercises 41 and 42, find the...Ch. 3.5 - Prob. 42ECh. 3.5 - Prob. 43ECh. 3.5 - Prob. 44ECh. 3.5 - Finding a Limit In Exercises 43-46, find the...Ch. 3.5 - Prob. 46ECh. 3.5 - Prob. 47ECh. 3.5 - Prob. 48ECh. 3.5 - Prob. 49ECh. 3.5 - Prob. 50ECh. 3.5 - Engine Efficiency The efficiency (in percent) of...Ch. 3.5 - Physics Newtons First Law of Motion and Einsteins...Ch. 3.5 - Prob. 53ECh. 3.5 - Prob. 54ECh. 3.5 - Prob. 55ECh. 3.5 - HOW DO YOU SEE IT? The graph shows the temperature...Ch. 3.5 - Modeling Data The average typing speeds S (in...Ch. 3.5 - Modeling Data A heat probe is attached to the heat...Ch. 3.5 - Prob. 59ECh. 3.5 - Prob. 60ECh. 3.5 - Using the Definition of Limits at Infinity...Ch. 3.5 - Using the Definition of Limits at Infinity...Ch. 3.5 - Prob. 63ECh. 3.5 - Prob. 64ECh. 3.5 - Prob. 65ECh. 3.5 - Prob. 66ECh. 3.5 - Prob. 67ECh. 3.5 - Prob. 68ECh. 3.5 - Prob. 69ECh. 3.5 - Proof Use the definition of infinite limits at...Ch. 3.6 - CONCEPT CHECK Analyzing the Graph of a Function...Ch. 3.6 - Prob. 2ECh. 3.6 - Prob. 3ECh. 3.6 - Prob. 4ECh. 3.6 - Prob. 5ECh. 3.6 - Matching In Exercises 5-8, match the graph of the...Ch. 3.6 - Matching In Exercises 5-8, match the graph of the...Ch. 3.6 - Matching In Exercises 5-8, match the graph of the...Ch. 3.6 - Prob. 9ECh. 3.6 - Analyzing the Graph of a Function In Exercises...Ch. 3.6 - Prob. 11ECh. 3.6 - Prob. 12ECh. 3.6 - Analyzing the Graph of a Function In Exercises...Ch. 3.6 - Prob. 14ECh. 3.6 - Prob. 15ECh. 3.6 - Analyzing the Graph of a Function In Exercises...Ch. 3.6 - Prob. 17ECh. 3.6 - Prob. 18ECh. 3.6 - Prob. 19ECh. 3.6 - Prob. 20ECh. 3.6 - Prob. 21ECh. 3.6 - Prob. 22ECh. 3.6 - Prob. 23ECh. 3.6 - Prob. 24ECh. 3.6 - Prob. 25ECh. 3.6 - Prob. 26ECh. 3.6 - Prob. 27ECh. 3.6 - Prob. 28ECh. 3.6 - Prob. 29ECh. 3.6 - Prob. 30ECh. 3.6 - Prob. 31ECh. 3.6 - Prob. 32ECh. 3.6 - Prob. 33ECh. 3.6 - Prob. 34ECh. 3.6 - Prob. 35ECh. 3.6 - Prob. 36ECh. 3.6 - Prob. 37ECh. 3.6 - Prob. 38ECh. 3.6 - Prob. 39ECh. 3.6 - Prob. 40ECh. 3.6 - Prob. 41ECh. 3.6 - Prob. 42ECh. 3.6 - Analyzing the Graph of a Function In Exercises...Ch. 3.6 - Prob. 44ECh. 3.6 - Prob. 45ECh. 3.6 - Prob. 46ECh. 3.6 - Prob. 47ECh. 3.6 - Prob. 48ECh. 3.6 - Prob. 49ECh. 3.6 - Prob. 50ECh. 3.6 - Identifying Graphs In Exercises 51 and 52, the...Ch. 3.6 - Identifying Graphs In Exercises 51 and 52, the...Ch. 3.6 - Graphical Reasoning In Exercises 5356, use the...Ch. 3.6 - Graphical Reasoning In Exercises 5356, use the...Ch. 3.6 - Graphical Reasoning In Exercises 5356, use the...Ch. 3.6 - Prob. 56ECh. 3.6 - Graphical Reasoning Consider the function...Ch. 3.6 - Prob. 58ECh. 3.6 - Prob. 59ECh. 3.6 - Prob. 60ECh. 3.6 - Prob. 61ECh. 3.6 - EXPLORING CONCEPTS Using a Derivative Let f(0) = 3...Ch. 3.6 - Prob. 63ECh. 3.6 - HOW DO YOU SEE IT? The graph of f is shown in the...Ch. 3.6 - Prob. 65ECh. 3.6 - Prob. 66ECh. 3.6 - Prob. 67ECh. 3.6 - Prob. 68ECh. 3.6 - Prob. 69ECh. 3.6 - Prob. 70ECh. 3.6 - Prob. 71ECh. 3.6 - Prob. 72ECh. 3.6 - Prob. 73ECh. 3.6 - Prob. 74ECh. 3.6 - Prob. 75ECh. 3.6 - Prob. 76ECh. 3.6 - Prob. 77ECh. 3.6 - Graphical Reasoning Identify the real numbers...Ch. 3.6 - Think About It In Exercises 7982, create a...Ch. 3.6 - Prob. 80ECh. 3.6 - Prob. 81ECh. 3.6 - Think About It In Exercises 7982, create a...Ch. 3.6 - Prob. 83ECh. 3.6 - Prob. 84ECh. 3.6 - Prob. 85ECh. 3.6 - Prob. 86ECh. 3.6 - Prob. 87ECh. 3.6 - Prob. 88ECh. 3.6 - Prob. 89ECh. 3.6 - Prob. 90ECh. 3.6 - Prob. 91ECh. 3.6 - Prob. 92ECh. 3.6 - Prob. 93ECh. 3.6 - Prob. 94ECh. 3.7 - CONCEPT CHECK Writing In your own words, describe...Ch. 3.7 - CONCEPT CHECK Optimization Problems In your own...Ch. 3.7 - Numerical, Graphical, and Analytic Analysis Find...Ch. 3.7 - Numerical, Graphical, and Analytic Analysis An...Ch. 3.7 - Prob. 5ECh. 3.7 - Prob. 6ECh. 3.7 - Finding Numbers In Exercises 510, find two...Ch. 3.7 - Finding Numbers In Exercises 510, find two...Ch. 3.7 - Prob. 9ECh. 3.7 - Prob. 10ECh. 3.7 - Prob. 11ECh. 3.7 - Maximum Area In Exercises 11 and 12, find the...Ch. 3.7 - Minimum Perimeter In Exercises 13 and 14, find the...Ch. 3.7 - Minimum Perimeter In Exercises 13 and 14, find the...Ch. 3.7 - Prob. 15ECh. 3.7 - Prob. 16ECh. 3.7 -
17. Minimum Area A rectangular poster is to...Ch. 3.7 - Minimum Area A rectangular page is to contain 36...Ch. 3.7 - Prob. 19ECh. 3.7 - Maximum Volume A rectangular solid (with a square...Ch. 3.7 - Maximum Area A Norman window is constructed by...Ch. 3.7 - Maximum Area A rectangle is bounded by the x- and...Ch. 3.7 - Minimum Length and Minimum Area A right triangle...Ch. 3.7 - Maximum Area Find the area of the largest...Ch. 3.7 - Maximum Area A rectangle is bounded by the x-axis...Ch. 3.7 - Prob. 26ECh. 3.7 - Prob. 27ECh. 3.7 - Numerical, Graphical, and Analytic Analysis A...Ch. 3.7 - Prob. 29ECh. 3.7 - Maximum Volume Rework Exercise 29 for a...Ch. 3.7 - Prob. 31ECh. 3.7 - EXPLORING CONCEPTS Area and Perimeter The...Ch. 3.7 - Minimum Surface Area A solid is formed by...Ch. 3.7 - Prob. 34ECh. 3.7 - Minimum Area The sum of the perimeters of an...Ch. 3.7 - Prob. 36ECh. 3.7 - Beam Strength A wooden beam has a rectangular...Ch. 3.7 - Minimum Length Two factories are located at the...Ch. 3.7 - Minimum Cost An offshore oil well is 2 kilometers...Ch. 3.7 - Illumination A light source is located over the...Ch. 3.7 - Prob. 41ECh. 3.7 - Minimum Time The conditions are the same as in...Ch. 3.7 - Minimum Distance Sketch the graph of f(x)=22sinx...Ch. 3.7 - Minimum Time When light waves traveling in a...Ch. 3.7 - Maximum Volume A sector with central angle is cut...Ch. 3.7 - Numerical, Graphical, and Analytic Analysis The...Ch. 3.7 - Prob. 47ECh. 3.7 - Prob. 48ECh. 3.7 - Prob. 49ECh. 3.7 - Prob. 50ECh. 3.7 - Prob. 51ECh. 3.7 - Prob. 52ECh. 3.7 - Prob. 53ECh. 3.7 - Prob. 54ECh. 3.7 - Prob. 55ECh. 3.7 - PUTNAM EXAM CHALLENGE Find the minimum value of...Ch. 3.8 - Prob. 1ECh. 3.8 - Prob. 2ECh. 3.8 - Prob. 3ECh. 3.8 - Prob. 4ECh. 3.8 - Prob. 5ECh. 3.8 - Using Newtons Method In Exercises 3-6, calculate...Ch. 3.8 - Prob. 7ECh. 3.8 - Using Newton's Method In Exercises 7-16, use...Ch. 3.8 - Prob. 9ECh. 3.8 - Prob. 10ECh. 3.8 - Prob. 11ECh. 3.8 - Prob. 12ECh. 3.8 - Prob. 13ECh. 3.8 - Prob. 14ECh. 3.8 - Prob. 15ECh. 3.8 - Prob. 16ECh. 3.8 - Prob. 17ECh. 3.8 - Prob. 18ECh. 3.8 - Points of Intersection In Exercises 17-20, apply...Ch. 3.8 - Points of Intersection In Exercises 17-20, apply...Ch. 3.8 - Using Newton's Method Consider the function...Ch. 3.8 - Prob. 22ECh. 3.8 - Prob. 23ECh. 3.8 - Failure of Newton's Method In Exercises 23 and 24,...Ch. 3.8 - Prob. 25ECh. 3.8 - Fixed Point In Exercises 25 and 26, approximate...Ch. 3.8 - Prob. 27ECh. 3.8 - Prob. 28ECh. 3.8 - Prob. 29ECh. 3.8 - Prob. 30ECh. 3.8 - Prob. 31ECh. 3.8 - Prob. 32ECh. 3.8 - Mechanics Rule The Mechanics Rule for...Ch. 3.8 - Approximating Radicals (a) Use Newtons Method and...Ch. 3.8 - Approximating Reciprocals Use Newtons Method to...Ch. 3.8 - Prob. 36ECh. 3.8 - Prob. 37ECh. 3.8 - True or False? In Exercises 3740, determine...Ch. 3.8 - True or False? In Exercises 3740, determine...Ch. 3.8 - True or False? In Exercises 3740, determine...Ch. 3.8 - Tangent Lines The graph of f(x)=sinx has...Ch. 3.8 - Point of Tangency The graph of f(x)=cosx and a...Ch. 3.9 - CONCEPT CHECK Tangent Line Approximations What is...Ch. 3.9 - Prob. 2ECh. 3.9 - Prob. 3ECh. 3.9 - CONCEPT CHECK Finding Differentials Explain how to...Ch. 3.9 - Prob. 5ECh. 3.9 - Prob. 6ECh. 3.9 - Prob. 7ECh. 3.9 - Prob. 8ECh. 3.9 - Prob. 9ECh. 3.9 - Using a Tangent Line Approximation In Exercises...Ch. 3.9 - Verifying a Tangent Line Approximation In...Ch. 3.9 - Prob. 12ECh. 3.9 - Prob. 13ECh. 3.9 - Prob. 14ECh. 3.9 - Prob. 15ECh. 3.9 - Prob. 16ECh. 3.9 - Prob. 17ECh. 3.9 - Prob. 18ECh. 3.9 - Finding a Differential In Exercises 1928, find the...Ch. 3.9 - Prob. 20ECh. 3.9 - Prob. 21ECh. 3.9 - Prob. 22ECh. 3.9 - Prob. 23ECh. 3.9 - Prob. 24ECh. 3.9 - Prob. 25ECh. 3.9 - Prob. 26ECh. 3.9 - Prob. 27ECh. 3.9 - Prob. 28ECh. 3.9 - Using Differentials In Exercises 29 and 30, use...Ch. 3.9 - Using Differentials In Exercises 29 and 30, use...Ch. 3.9 - Prob. 31ECh. 3.9 - Using Differentials In Exercises 31 and 32, use...Ch. 3.9 - Area The measurement of the side of a square floor...Ch. 3.9 - Area The measurements of the base and altitude of...Ch. 3.9 - Volume and Surface Area The measurement of the...Ch. 3.9 - Volume and Surface Area The radius of a spherical...Ch. 3.9 - Stopping Distance The total stopping distance T of...Ch. 3.9 - Prob. 38ECh. 3.9 - Pendulum The period of a pendulum is given by...Ch. 3.9 - Prob. 40ECh. 3.9 - Projectile Motion The range R of a projectile is...Ch. 3.9 - Surveying A surveyor standing 50 feet from the...Ch. 3.9 - Approximating Function Values In Exercises 4346,...Ch. 3.9 - Prob. 44ECh. 3.9 - Prob. 45ECh. 3.9 - Prob. 46ECh. 3.9 - Prob. 47ECh. 3.9 - Using Defferentials Give a short explanation of...Ch. 3.9 - Prob. 49ECh. 3.9 - Prob. 50ECh. 3.9 - Prob. 51ECh. 3.9 - Prob. 52ECh. 3.9 - Prob. 53ECh. 3 - Finding Extrema on a Closed Interval In Exercises...Ch. 3 - Finding Extrema on a Closed Interval In Exercises...Ch. 3 - Prob. 3RECh. 3 - Prob. 4RECh. 3 - Prob. 5RECh. 3 - Prob. 6RECh. 3 - Prob. 7RECh. 3 - Prob. 8RECh. 3 - Prob. 9RECh. 3 - Prob. 10RECh. 3 - Prob. 11RECh. 3 - Prob. 12RECh. 3 - Prob. 13RECh. 3 - Prob. 14RECh. 3 - Prob. 15RECh. 3 - Prob. 16RECh. 3 - Prob. 17RECh. 3 - Prob. 18RECh. 3 - Prob. 19RECh. 3 - Prob. 20RECh. 3 - Prob. 21RECh. 3 - Prob. 22RECh. 3 - Prob. 23RECh. 3 - Prob. 24RECh. 3 - Prob. 25RECh. 3 - Prob. 26RECh. 3 - Prob. 27RECh. 3 - Applying the First Derivative Test In Exercises...Ch. 3 - Prob. 29RECh. 3 - Prob. 30RECh. 3 - Prob. 31RECh. 3 - Applying the First Derivative Test In Exercises...Ch. 3 - Prob. 33RECh. 3 - Prob. 34RECh. 3 - Prob. 35RECh. 3 - Prob. 36RECh. 3 - Prob. 37RECh. 3 - Prob. 38RECh. 3 - Prob. 39RECh. 3 - Prob. 40RECh. 3 - Prob. 41RECh. 3 - Prob. 42RECh. 3 - Prob. 43RECh. 3 - Prob. 44RECh. 3 - Prob. 45RECh. 3 - Prob. 46RECh. 3 - Prob. 47RECh. 3 - Using the Second Derivative Test In Exercises...Ch. 3 - Prob. 49RECh. 3 - Prob. 50RECh. 3 - Prob. 51RECh. 3 - Prob. 52RECh. 3 - Prob. 53RECh. 3 - Prob. 54RECh. 3 - Prob. 55RECh. 3 - Prob. 56RECh. 3 - Prob. 57RECh. 3 - Prob. 58RECh. 3 - Prob. 59RECh. 3 - Prob. 60RECh. 3 - Prob. 61RECh. 3 - Prob. 62RECh. 3 - Prob. 63RECh. 3 - Prob. 64RECh. 3 - Prob. 65RECh. 3 - Prob. 66RECh. 3 - Prob. 67RECh. 3 - Prob. 68RECh. 3 - Prob. 69RECh. 3 - Prob. 70RECh. 3 - Prob. 71RECh. 3 - Prob. 72RECh. 3 - Prob. 73RECh. 3 - Prob. 74RECh. 3 - Prob. 75RECh. 3 - Prob. 76RECh. 3 - Prob. 77RECh. 3 - Prob. 78RECh. 3 - Finding Numbers Find two positive numbers such...Ch. 3 - Prob. 80RECh. 3 - Maximum Area A rancher has 400 feet of fencing...Ch. 3 - Maximum Area Find the dimensions of the rectangle...Ch. 3 - Prob. 83RECh. 3 - Minimum Length The wall of a building is to be...Ch. 3 - Prob. 85RECh. 3 - Prob. 86RECh. 3 - Prob. 87RECh. 3 - Prob. 88RECh. 3 - Prob. 89RECh. 3 - Prob. 90RECh. 3 - Prob. 91RECh. 3 - Prob. 92RECh. 3 - Prob. 93RECh. 3 - Prob. 94RECh. 3 - Prob. 95RECh. 3 - Prob. 96RECh. 3 - Prob. 97RECh. 3 - Prob. 98RECh. 3 - Prob. 99RECh. 3 - Prob. 100RECh. 3 - Prob. 101RECh. 3 - Relative Extrema Graph the fourth-degree...Ch. 3 - Relative Extrema (a) Graph the fourth-degree...Ch. 3 - Relative Minimum Let f(x)=cx+x2 Determine all...Ch. 3 - Points of Inflection (a) Let f(x)=ax2+bx+c,a0, be...Ch. 3 - Extended Mean Value Theorem Prove the Extended...Ch. 3 - Illumination The amount of illumination of a...Ch. 3 - Minimum Distance Consider a room in the shape of a...Ch. 3 - Areas of Triangles The line joining P and Q...Ch. 3 - Mean Value Theorem Determine the values a, b, and...Ch. 3 - Mean Value Theorem Determine the values a. b, c....Ch. 3 - Proof Let f and g be functions that are continuous...Ch. 3 - Proof (a) Prove that limxx2= (b) Prove that...Ch. 3 - Tangent Lines Find the point on the graph of...Ch. 3 - Stopping Distance The police department must...Ch. 3 - Darbouxs Theorem Prove Darbouxs Theorem: Let f be...Ch. 3 - Maximum Area The figures show a rectangle, a...Ch. 3 - Point of Inflection Show that the cubic polynomial...Ch. 3 - Minimum Length A legal-sized sheet of paper (8.5...Ch. 3 - Quadratic Approximation The polynomial...
Knowledge Booster


Learn more about
Need a deep-dive on the concept behind this application? Look no further. Learn more about this topic, calculus and related others by exploring similar questions and additional content below.Similar questions
- Calculus lll May I please have the statements with blank lines completed; furthermore, may I please have the text box completed? Thank youarrow_forwardCalculus lll May I please have the statements completed for the following text lines and box? Thank you so much,arrow_forwardCalculus lll May I please have the solution for the following exercise? Thank you so mucharrow_forward
- Calculus lll May I please have the statement completed for the following box? Thank you so much,arrow_forwardCalculus lll May I please have the solution for the following exercise? Thank you so mucharrow_forwardUse a graphing calculator to find where the curves intersect and to find the area between the curves. y=ex, y=-x²-4x a. The left point of intersection is (Type integers or decimals rounded to the nearest thousandth as needed. Type an ordered pair.)arrow_forward
- Find the area between the curves. x= -5, x=3, y=2x² +9, y=0 The area between the curves is (Round to the nearest whole number as needed.)arrow_forwardcan you solve these questions with step by step with clear explaination pleasearrow_forwardFind the area between the following curves. x=-1, x=3, y=x-1, and y=0 The area between the curves is (Simplify your answer.)arrow_forward
arrow_back_ios
SEE MORE QUESTIONS
arrow_forward_ios
Recommended textbooks for you
 Algebra & Trigonometry with Analytic GeometryAlgebraISBN:9781133382119Author:SwokowskiPublisher:Cengage
Algebra & Trigonometry with Analytic Geometry
Algebra
ISBN:9781133382119
Author:Swokowski
Publisher:Cengage
Derivatives of Trigonometric Functions - Product Rule Quotient & Chain Rule - Calculus Tutorial; Author: The Organic Chemistry Tutor;https://www.youtube.com/watch?v=_niP0JaOgHY;License: Standard YouTube License, CC-BY