
Introduction to Probability and Statistics
14th Edition
ISBN: 9781133103752
Author: Mendenhall, William
Publisher: Cengage Learning
expand_more
expand_more
format_list_bulleted
Concept explainers
Videos
Textbook Question
Chapter 3.2, Problem 3.6E
Consumer Price Index The price of living in the United States has increased dramatically in the past decade, as demonstrated by the consumer price indexes (CPIs) for housing and transportation. These CPI are listed in the table for the years 1996 through the first half of 2010.3
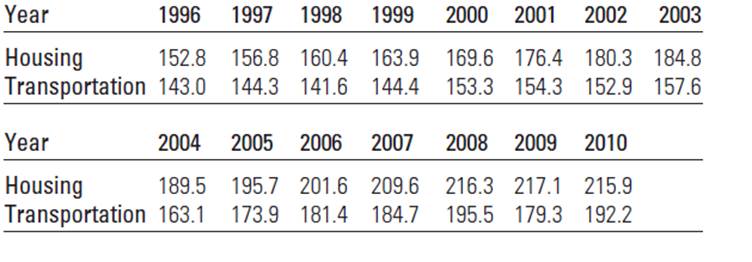
a. Create side-by-side comparative bar charts to describe the CPIs over time.
b. Draw two line charts on the same set of axes to describe the CPIs over time.
c. What conclusions can you draw using the two graphs in parts a and b? Which is the most effective?
Expert Solution & Answer
Want to see the full answer?
Check out a sample textbook solution
Students have asked these similar questions
The side-by-side bar graph available below shows the approximate average grade point average for the
years 1991-1992, 1996-1997, 2001-2002, and 2006-2007 for colleges and universities. Complete parts (a) through (c)
below.
Click the icon to view the side-by-side bar graph.
(a) Does the graph suggest that grade inflation is a problem in colleges?
A. Yes, because the GPAS increased over time for all schools.
B. No, because nothing can be concluded about individual GPAS from the averages.
C. No, because the GPAS are different for each time period.
D. Yes, because the GPAS are greater for private schools for every time period.
(b) In public schools, the average GPA was 2.86 in 1991-1992 and 3.02 in 2006-2007. In private schools, the average
GPA was 3.09 in 1991-1992 and 3.30 in 2006-2007. Determine the percentage increase in GPAs for public schools
from 1991 to 2006. Determine the percentage increase in GPAs for private schools from 1991 to 2006. Which type of
institution appears to have…
The average price (in cents) per pound
of sugar observed during the period
September 2012 to September 2013 in
most US cities is displayed in the line
graph provided. What was the
percentage increase in the price (in
cents) per pound of sugar from
November 2012 to January 2013?
18.6
Average price of sugar in US cities
17.8
17.0
16.2
15.4
14.6
13.8
13.0
Sep-12
Nov-12
Dec-12
Jan-13
Mar-13
Apr-13
Feb-13
May-13
Jun-13
Jul-13
Sep-13
Oct-12
Aug-13
The Consumer Price Index provides a means of determining the purchasing power of the U.S. dollar from one year to the next. To use the Consumer Price Index to predict a price in a particular year, we can set up a proportion and compare it with a known price in another year as follows:(price in year A)/(index in year A)=(price in year B)/(index in year B)In 1986 the Consumer Price Index was 109.6 and in 2010 it was 218.1. Find the amount that would be charged in 2010 for the use of the same amount of electricity that cost $110 in 1986. Give your answer to the nearest dollar.
Chapter 3 Solutions
Introduction to Probability and Statistics
Ch. 3.2 - Gender Differences Male and female respond ents to...Ch. 3.2 - Prob. 3.2ECh. 3.2 - Consumer Spending The table below shows the...Ch. 3.2 - Prob. 3.4ECh. 3.2 - Prob. 3.5ECh. 3.2 - Consumer Price Index The price of living in the...Ch. 3.2 - Prob. 3.7ECh. 3.2 - Prob. 3.8ECh. 3.4 - Suppose that the relationship between two...Ch. 3.4 - Prob. 3.10E
Ch. 3.4 - A set of bivariate data consists of these...Ch. 3.4 - Prob. 3.12ECh. 3.4 - Consider this set of bivariate data: a. Draw a...Ch. 3.4 - Prob. 3.14ECh. 3.4 - Grocery Costs These data relating the amount spent...Ch. 3.4 - Prob. 3.16ECh. 3.4 - Prob. 3.17ECh. 3.4 - Prob. 3.18ECh. 3.4 - Prob. 3.19ECh. 3.4 - Prob. 3.20ECh. 3 - Prob. 3.21SECh. 3 - Cheese, Please! Health-conscious Americans often...Ch. 3 - Prob. 3.23SECh. 3 - Prob. 3.24SECh. 3 - Prob. 3.25SECh. 3 - Prob. 3.26SECh. 3 - Prob. 3.27SECh. 3 - Prob. 3.28SECh. 3 - Prob. 3.29SECh. 3 - Prob. 3.30SECh. 3 - Prob. 3.31SECh. 3 - Pottery, continued Here is the percentage of...Ch. 3 - Gestation Times and Longevity The table below...Ch. 3 - Prob. 3.34SECh. 3 - Armspan and Height Leonardo da Vinci (1452-1519)...Ch. 3 - Armspan and Height Leonardo da Vinci(14521519)...Ch. 3 - Prob. 3.37SECh. 3 - Prob. 3.38SECh. 3 - Prob. 3.39SECh. 3 - Rain and Snow Is there a correlation between the...Ch. 3 - Prob. 3.41SECh. 3 - Prob. 1CSCh. 3 - Prob. 2CSCh. 3 - Prob. 3CS
Knowledge Booster


Learn more about
Need a deep-dive on the concept behind this application? Look no further. Learn more about this topic, statistics and related others by exploring similar questions and additional content below.Similar questions
- Find the mean hourly cost when the cell phone described above is used for 240 minutes.arrow_forward2. Which of the following statements is false? Explain your answer. A. A price index can be used to compare changes in prices over time. B. A graph of the average monthly price of gas is an example of an index. C. Price index values are often calculated relative to a base value at a certain point in time or in a certain place. D. Index values can be greater than 100.arrow_forwardvt 14. Calculate trend values by the method of Least Square from the data given below and estimate the sales for 2007. Year 2000 2001 2002 2003 2004 Sales of GA. (Rs. lakhs) 70 74 80 86 90 上arrow_forward
- at 2 presented based on the Health Information National Trends Survey (HINTS) LALYSISarrow_forwardJohn Kittle, an independent insurance agent, uses a five-year moving average to forecast the number of claims made in a single year for one of the large insurance companies he sells for. He has just discovered that a clerk in his employ incorrectly entered the number of claims made four years ago as 1,400 when it should have been 1,200.a. What adjustment should Mr. Kittle make in next year’s forecast to take into account the corrected value of the number of claims four years ago?b. Suppose that Mr. Kittle used simple exponential smoothing with a = .2instead of moving averages to determine his forecast. What adjustment is now required in next year’s forecast? (Note that you do not need to know the value of the forecast for next year in order to solve this problem.)arrow_forwardOver the past three decades, the cost of college has increased at a much greater rate than the CPI. What does this mean for the average family? Group of answer choices College has become more difficult to afford. Using the same years as the CPI for reference values, an index of the cost of college would be greater than the CPI. A college education is more valuable today than ever before. Using the same years as the CPI for reference values, an index of the cost of college would be less than the CPI. A college education is more valuable today than ever before. Using the same years as the CPI for reference values, an index of the cost of college would be greater than the CPI. College has become easier to afford. Using the same years as the CPI for reference values, an index of the cost of college would be greater than the CPI. College has become more difficult to afford. Using the same years as the CPI for reference values, an index of the cost of college would be less…arrow_forward
- eat out or in The overall change in the consumer price index is a weighted average of changes in various categories. on november 19, 2011 the boston globe reported the data displayed in figure 5.7. the change in the CPI for food is a weighted average of the change in the cost of food at home and the change in the cost of food away from home. find the weights.arrow_forwardWith aging, body fat increases and muscle mass declines. The line graphs show the percent body fat in adult women and men as they age from 25 to 75 years. Use this information to complete parts (a) through (c) below. Percent Body Fat in Adults 40- 36- Women .....- 32- a. Find an estimate for the percent body fat in 75-year-old women. 28- 36 % Men 24- (Type a whole number.) b. At what age does the percent body fat in women reach a 20나 15 25 35 45 55 65 75 maximum? Age 55 years old (Type a whole number.) What is the percent body fat for that age? 38 % (Type a whole number.) c. At what age do women have 34% body fat? years old (Type a whole number.) ..... Percent Body Fatarrow_forwardWith aging, body fat increases and muscle mass declines. The line graphs show the percent body fat in adult women and men as they age from 25 to 75 years. Use this information to complete parts (a) through (c) below. Percent Body Fat in Adults 36- Women 32- .... a. Find an estimate for the percent body fat in 75-year-old 28- women. Men 24- % (Type a whole number.) 20- 15 55 25 35 45 Age 65 75 Percent Body Fatarrow_forward
arrow_back_ios
arrow_forward_ios
Recommended textbooks for you
 College AlgebraAlgebraISBN:9781305115545Author:James Stewart, Lothar Redlin, Saleem WatsonPublisher:Cengage Learning
 College Algebra (MindTap Course List)AlgebraISBN:9781305652231Author:R. David Gustafson, Jeff HughesPublisher:Cengage Learning
 Algebra: Structure And Method, Book 1AlgebraISBN:9780395977224Author:Richard G. Brown, Mary P. Dolciani, Robert H. Sorgenfrey, William L. ColePublisher:McDougal Littell
College Algebra
Algebra
ISBN:9781305115545
Author:James Stewart, Lothar Redlin, Saleem Watson
Publisher:Cengage Learning
College Algebra (MindTap Course List)
Algebra
ISBN:9781305652231
Author:R. David Gustafson, Jeff Hughes
Publisher:Cengage Learning
Algebra: Structure And Method, Book 1
Algebra
ISBN:9780395977224
Author:Richard G. Brown, Mary P. Dolciani, Robert H. Sorgenfrey, William L. Cole
Publisher:McDougal Littell
Probability & Statistics (28 of 62) Basic Definitions and Symbols Summarized; Author: Michel van Biezen;https://www.youtube.com/watch?v=21V9WBJLAL8;License: Standard YouTube License, CC-BY
Introduction to Probability, Basic Overview - Sample Space, & Tree Diagrams; Author: The Organic Chemistry Tutor;https://www.youtube.com/watch?v=SkidyDQuupA;License: Standard YouTube License, CC-BY