Concept explainers
Videos
HOW DO YOU SEE IT? The figure shows the graph of g'
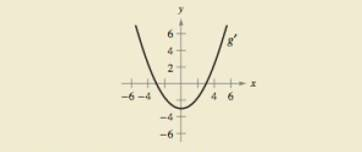
(a)
(b)
(c) What can you conclude about the graph of g knowing that
(d) What can you conclude about the graph of g knowing that
(e) Is g(6)- g(4) positive or negative? Explain.
(f) Is it possible to find g(2) from the graph? Explain.
Want to see the full answer?
Check out a sample textbook solution
Chapter 3 Solutions
Calculus: Early Transcendental Functions


- Use the graph of f'(x) to identify the graph of f (x). 10 B- 6- 2- -4 -3 -2. -6 -8-arrow_forwardUse the graph of f and g. p(x) = f(x)g(x) g(x) = f(x) g(x) -2 10- 8 6 2 0 (a) Find p'(8). p'(8) = (b) Find q'(1). q'(1) = 2 4 X f 8 g 10arrow_forwardIn a study on the speed of muscle contraction in a certain species of frogs under various loads, researchers found that the speed of contraction decreases with increasing loads. In particular, they found that the relationship between speed of contraction v (in centimeters per 25 +0.07x second) and load x (in grams) is given approximately by v(x) = - -, x>5. X (A) What does v(x) approach as x increases? (B) Sketch a graph of the function v. (A) As x increases, v(x) approachesarrow_forward
- The figure shows the graph of g'. y 14 12 10아 8. 6. g'(x) 4 -10 -8 -6-4 80 2 -2- 4 9. 10 -4 -아 (a) Find g'(0). (b) Find g'(3). 21arrow_forward3-4 Match each equation with its graph. Explain your choice: (Don't use a computer or graphing calculator.) 3. (a) y = x (b) y =x' (c) y = x* 0. f 4. (a) y = 3x (c) y = x' (b) y = 3* (d) y = Vx yA F Garrow_forwardSketch graph of Y=-4(x)(x)arrow_forward
- The graph of the functions f and g are shown below. 5 g(x) f(r) -5 5 (a) Let h(x) = f (x)/g(x). Find h'(1). (b) Let h(x) = g(f(x)). Find h'(-1).arrow_forwardSuppose that the function y = f(x) is increasing on the interval [- 1, 5].(a) Over what interval is the graph of y = f(x + 2) increasing?(b) Over what interval is the graph of y = f(x - 5) increasing?(c) What can be said about the graph of y = - f(x)?(d) What can be said about the graph of y = f( - x)?arrow_forwardCompared with the graph of f(x) the graph of x' 1 g(x) : 1 is shifted 2 units , and x + 2 1 unitarrow_forward
- Let G=5f-g look at graph attached G’(1)=?arrow_forward13) Use the accompanying graph of y = f(x) to sketch a graph of each equation and complete the table of all the new points. (a) y = f(x + 1) + 1 (b) y = -f(x) – 1 (c) y = } f(2x) Given New New New Points points (a) points (b) points (c) (-1, 2) y = f(x) (-2,0) (-2, oy (0, 0) (2, 0) (-1,2) (0,0) (1, –2) (1,-2) (2, 0)arrow_forwardConsider the graph of the function g(x) given below. g(x) -2 B) If h(x) [Select] C) If i(x) [Select] = -4- A) If f(x) = xg(x), calculate f' (3). [ Select] - 2- 0 -2 X g(x) 2 9 calculate h' (-1). e f(x), calculate i” (1). X 4arrow_forward
 Algebra & Trigonometry with Analytic GeometryAlgebraISBN:9781133382119Author:SwokowskiPublisher:Cengage
 Calculus For The Life SciencesCalculusISBN:9780321964038Author:GREENWELL, Raymond N., RITCHEY, Nathan P., Lial, Margaret L.Publisher:Pearson Addison Wesley,