
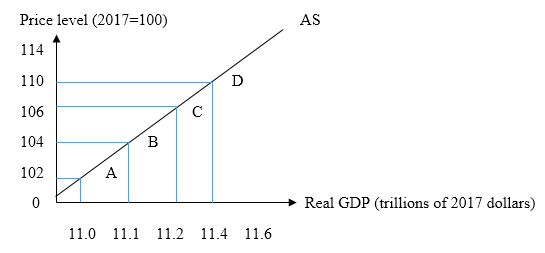
To plot:
The
Explanation of Solution
Aggregate suppply curve;
Phillips curve;
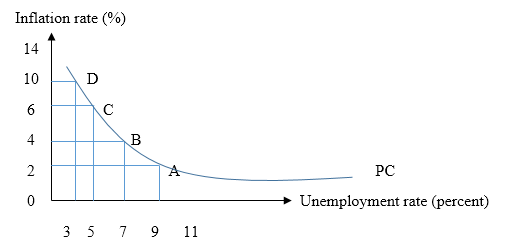
Philips curve:
The Phillips curve is an economic concept which states a significant opposite relationship between inflation and
Want to see more full solutions like this?
Chapter 31 Solutions
Foundations of Economics, Student Value Edition Plus MyLab Economics with eText -- Access Card Package (8th Edition)

- (i) Examine the extent to which policymakers face a trade-off between unemployment and inflation, (ii) The Phillips curve suggests there is a trade-off between inflation and unemployment, at least in the short term. Other economists argue the trade- off between inflation and unemployment is weak. Analyse this trade-off when Bank Indonesia (Central Bank of China) decreases reserve requirement ratio. (iii) Draw the model of aggregate demand and aggregate supply diagram with the Phillips curve.arrow_forwardThe following graphs show the state of an economy that is currently in long-run equilibrium. The first graph shows the aggregate demand (AD) and long-run aggregate supply (LRAS) curves. The second shows the long-run and short-run Phillips curves (LRPC and SRPC). PRICE LEVEL INFLATION RATE 0 3 LRAS 4 5 LRPC 9 AD O AD LRAS 6 12 UNEMPLOYMENT RATE (Percent) 15 SRPC 18 Ⓒ SRPC - LRPCarrow_forwardAggregate demand, aggregate supply, and the Phillips curve In the year 2027, aggregate demand and aggregate supply in the imaginary country of Daisen-Oki are represented by the curves AD 2027 and AS on the following graph. The price level is currently 102. The graph also shows two potential outcomes for 2028. The first possible aggregate demand curve is given by the curve labeled AD(a) curve, resulting in the outcome given by point A. The second possible aggregate demand curve is given by the curve labeled AD(b), resulting in the outcome given by point B. Suppose the unemployment rate is 7% under one of these two outcomes and 6% under the other. Based on the previous graph, you would expect (OUTCOME A or OUTCOME B) to be associated with the higher unemployment rate (7%). If aggregate demand is high in 2028, and the economy is at outcome B, the inflation rate between 2027 and 2028 is (1.96% or 5.00% or 4.00% or 2.94%). Based on your answers to the previous…arrow_forward
- The following graphs show the state of an economy that is currently in Tong-run equilibrium. The first graph shows the aggregate demănd (AD) and long-run aggregate supply (LRAS) curves. The second shows the long-run and short-run Phìllips curves (LRPC and SRPC). LRAS AD LRAS AD 12 15 18 OUTPUT (Trillions af dollars) LRPC SRPC LRPC SRPC 10 12 UNEMPLOYMENT RATE (Percent) Which of the following statements are true based on these graphs? Check all that apply. - The current quantity of output is greater than potential output. The natural level of output is $9 trillion. - The unemployment rate is currently 6% higher than the natural rate of unemployment. Suppose the central bank of the economy increases the money supply. Show the long-run effects of this policy on both of the graphs by shifting the appropriate curves. in the The long-run effect of the central bank's policy is inflation rate, real GDP. in the unemployment rate, and in INFLATION RATEarrow_forwardThe corresponding table includes a breakdown including Inflation Rate, Unemployment Rate, Price Level, and Real GDP. Using the data below, plot the graphs: Plot the short-run Phillips curve and the aggregate supply curve on separate graphs. Plot the long-run Phillips curve on a separate graph, when the natural unemployment rate is 6%. Inflation Rate Unemployment Rate Price Level Real GDP 2% 7% 104 9.8 3% 6% 103 10.0 4% 5% 102 10.2arrow_forwardThe Economy in 2008In the first half of June 2008 the effects of a housing and financial crisis and an increase in world prices of oil and foodstuffs were affecting the economy. Refer to The Economy in 2008. The short-run effects of rising world commodity prices are shown by a. moving to the right along the short-run Phillips curve. b. shifting the short-run Phillips curve right. c. moving to the left along the short-run Phillips curve. d. shifting the short-run Phillips curve left.arrow_forward
- The table below shows unemployment and inflation data in Country Y after a shift in aggregate demand. Period 2021 2022 Unemployment Rate 2% 5% Inflation Rate 8% 4% A. Draw a correctly labeled graph of the short run Phillips Curve for Country Y. Show the actual unemployment and inflation rate for both years. Label the Phillips Curve as SRPC. B. Now, the short run aggregate supply curve has shifted left. i. Identify one cause that would shift short run aggregate supply to the left. ii. On your graph in Part A, show how this shift would impact the short run Phillips Curve.arrow_forwardAssume that a country's economy is in equilibrium. a) () Using a correctly labeled AD/AS graph, show how an increase in the price of gasoline, an important input of production, will affect the following in the short run. (i) Real output :- (ii) Price level-Using a correctly labeled graph, show the same effect on the Phillips curve. () Central bank of the country responds to the higher price of oil by increasing the money supply. (i ) ()Explain the process by which the increase in the money supply will affect the aggregate demand in the short run. (ii) (Indicate on the AD/AS graph, how the increase in the money supply will affect real output and the price level. d) () Now assume that instead of using monetary policy in response to the gasoline price increase, the government reduces business taxes, which results in lower production costs. Using a new correctly labeled graph, show the effect of the reduction in business taxes on the following. (i) () Real output - (ii) () Price levele) (…arrow_forwardInflation rate (percent per year) C Unemployment rate (percent) Refer to Figure 17-8, A typical long-run Phillips curve would have the appearance of a curve running through points A and B. A and C. B and C. A, B, and C.arrow_forward
- Homework: Chapter 27 1. Aggregate demand, aggregate supply, and the Phillips curve In the year 2020, aggregate demand and aggregate supply in the fictional country of Bartak are represented by the curves AD20 and AS on the following graph. The price level is 102. The graph also shows two possible outcomes for 2021. The first potential aggregate demand curve is given by the ADA curve, resulting in the outcome illustrated by point A. The second potential aggregate demand curve is given by the ADB curve, resulting in the outcome illustrated by point B. PRICE LEVEL 106 AS 107 106 B 105 104 AD 2020 103 102 101 19V 100 D 10 AD OUTPUT (Trillions of dollars) ADB 12 14 (?) Suppose the unemployment rate is 6% under one of these two outcomes and 3% under the other. Based on the previous graph, you would expect to be associated with the lower unemployment rate (3%). outcome B outcome A emand is high in 2021, and the economy is at outcome B, the inflation rate between 2020 and 2021 is Based on your…arrow_forwardWhich of the following events is likely to increase unemployment and drive the price level down? Select one: a. The U.S. government lowering income and corporate taxes b. Strong economic growth in Mexico, one of our largest trade partners c. The Fed reducing the supply of money through an open market operations d. An increase in the price of fuel due to rising demand from India and China e. A rise in minimum wagearrow_forwardFor each of the following scenarios, illustrate the effects of the development on both the short-run and long-run Phillips curves (SRPC and LRPC, respectively). 1. There is a rise in the price of imported oil. 2. There is a fall in government spending.arrow_forward

 Principles of Economics (12th Edition)EconomicsISBN:9780134078779Author:Karl E. Case, Ray C. Fair, Sharon E. OsterPublisher:PEARSON
 Engineering Economy (17th Edition)EconomicsISBN:9780134870069Author:William G. Sullivan, Elin M. Wicks, C. Patrick KoellingPublisher:PEARSON
 Principles of Economics (MindTap Course List)EconomicsISBN:9781305585126Author:N. Gregory MankiwPublisher:Cengage Learning
 Managerial Economics: A Problem Solving ApproachEconomicsISBN:9781337106665Author:Luke M. Froeb, Brian T. McCann, Michael R. Ward, Mike ShorPublisher:Cengage Learning
 Managerial Economics & Business Strategy (Mcgraw-...EconomicsISBN:9781259290619Author:Michael Baye, Jeff PrincePublisher:McGraw-Hill Education