Answer to Problem 30.1LO
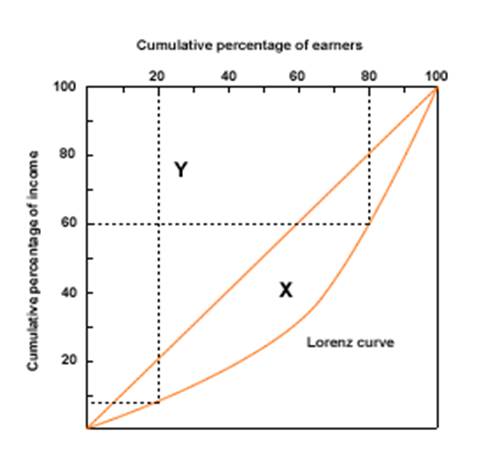
Lorenz curve shows the line of actual income distribution. If we compare it with the line of perfect equality we get the idea of the extent of inequality in the distribution of income in a country.
Explanation of Solution
Lorenz curve is the graphic method of studying dispersion. It is used to show the extent of departure dispersion between equal distribution and actual distribution of a variable.
In the diagram, the curved line shows the cumulative percentage of earners (on X axis), ranked from poorest to richest, against the cumulative percentage of total income (on Y axis). This is the Lorenz curve.
The Lorenz Curve is compared to the line of perfect equality to show the extent of income and wealth inequality in a country.
Introduction:
Lorenz curve and income inequality.
Lorenz curve: Lorenz curve is the graphic method of studying dispersion. It is used to show the extent of departure dispersion between equal distribution and actual distribution of a variable.
Want to see more full solutions like this?
Chapter 30 Solutions
ECON.TODAY (COMPLETE)-TEXT ONLY


 Principles of Economics (12th Edition)EconomicsISBN:9780134078779Author:Karl E. Case, Ray C. Fair, Sharon E. OsterPublisher:PEARSON
 Engineering Economy (17th Edition)EconomicsISBN:9780134870069Author:William G. Sullivan, Elin M. Wicks, C. Patrick KoellingPublisher:PEARSON
 Principles of Economics (MindTap Course List)EconomicsISBN:9781305585126Author:N. Gregory MankiwPublisher:Cengage Learning
 Managerial Economics: A Problem Solving ApproachEconomicsISBN:9781337106665Author:Luke M. Froeb, Brian T. McCann, Michael R. Ward, Mike ShorPublisher:Cengage Learning
 Managerial Economics & Business Strategy (Mcgraw-...EconomicsISBN:9781259290619Author:Michael Baye, Jeff PrincePublisher:McGraw-Hill Education