
Subpart (a):
Demand and supply.
Subpart (a):
Answer to Problem 4P
Explanation of Solution
When the supply decreases with constant demand curve, it will lead to a decrease in the
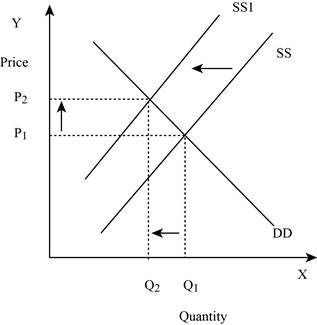
Figure -1
In Figure -1, the horizontal axis measures the quantity supplied and the vertical axis measures the price of the balls. ‘DD’ represents the demand and the demand curve shifts from DD to DD1; ‘SS’ represents the supply curve and the supply curve shifts from SS to SS1. Decrease in supply will lead to a decrease in the equilibrium quantity from ‘Q1 to Q2’ and an increase in the equilibrium price from ‘P1 to P2’.
Concept introduction:
Demand: Demand refers to the total value of the goods and services that are demanded at a particular price in the given period of time.
Supply: Supply refers to the total value of the goods and services that are available for purchase at a particular price in the given period of time.
Subpart (b):
Demand and supply.
Subpart (b):
Answer to Problem 4P
Price shifts down and quantity shifts down – b.
Explanation of Solution
When the demand decreases with constant supply curve, it will lead to a decrease in the equilibrium quantity and equilibrium price. This is shown below in Figure -2:
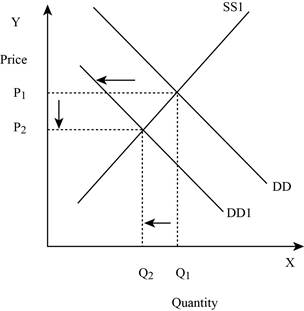
Figure -2
In Figure -2, the horizontal axis measures the quantity supplied and the vertical axis measures the price of the balls. ‘DD’ represents the demand and the demand curve shifts to the left from DD to DD1; ‘SS’ represents the supply curve. Decrease in supply will lead to a decrease in the equilibrium quantity from ‘Q1 to Q2’ and the equilibrium price from ‘P1 to P2’.
Concept introduction:
Demand: Demand refers to the total value of the goods and services that are demanded at a particular price in the given period of time.
Supply: Supply refers to the total value of the goods and services that are available for purchase at a particular price in the given period of time.
Subpart (c):
Demand and supply.
Subpart (c):
Answer to Problem 4P
Price shifts down and quantity shifts up – c.
Explanation of Solution
When the demand is constant with an increase in the supply curve, it will lead to a decrease in the equilibrium price and an increase in the equilibrium quantity. This is shown below in Figure -3:
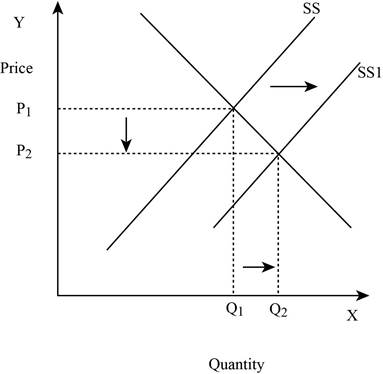
Figure -3
In Figure -3, the horizontal axis measures the quantity supplied and the vertical axis measures the price of the balls. ‘DD’ represents the demand and ‘SS’ represents the supply curve and the supply curve shifts to the right from SS to SS1. Increase in supply will lead to a decrease in the equilibrium price from ‘P1 to P2’ and an increase in the equilibrium quantity from ‘Q1 to Q2’.
Concept introduction:
Demand: Demand refers to the total value of the goods and services that are demanded at a particular price in the given period of time.
Supply: Supply refers to the total value of the goods and services that are available for purchase at a particular price in the given period of time.
Subpart (d):
Demand and supply.
Subpart (d):
Answer to Problem 4P
Price will indeterminate and quantity shifts up – d.
Explanation of Solution
When both the demand and supply increases, it will lead to an increase in the equilibrium quantity and the change in price is indeterminate. This is because an increase in the supply puts a downward pressure on the equilibrium price. This is shown below in Figure – 4:
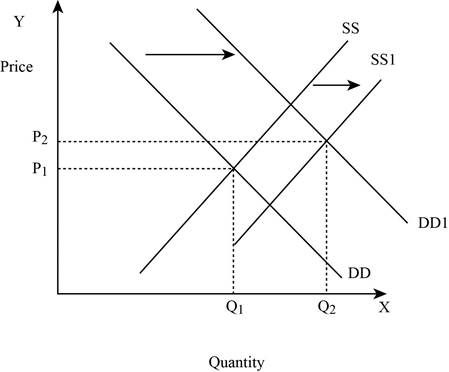
Figure -4
In Figure -4, the horizontal axis measures the quantity supplied and the vertical axis measures the price of the balls. ‘DD’ represents the demand curve and ‘SS’ represents the supply curve. Due to the increase in supply and demand, the supply curve shifts to the right from SS to SS1 and the demand curve shifts from DD to DD1. An increase in the supply leads to an increase in the equilibrium price from ‘P1 to P2’ and the equilibrium quantity from ‘Q1 to Q2’.
Concept introduction:
Demand: Demand refers to the total value of the goods and services that are demanded at a particular price in the given period of time.
Supply: Supply refers to the total value of the goods and services that are available for purchase at a particular price in the given period of time.
Subpart (e):
Demand and supply.
Subpart (e):
Answer to Problem 4P
Price shifts up and quantity shifts up – e.
Explanation of Solution
If the demand increases with constant supply, it leads to an increase in the equilibrium quantity and equilibrium price. This is shown below in Figure – 5:
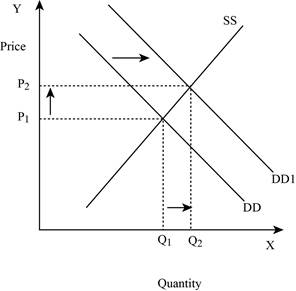
Figure -5
In Figure -5, the horizontal axis measures the quantity supplied and the vertical axis measures the price of the balls. ‘DD’ represents the demand curve and ‘SS’ represents the supply curve. Due to an increase in demand, the demand curve will shift the curve to the right from DD to DD1. An increase in demand will increase the equilibrium price from ‘P1 to P2’ and increases the equilibrium quantity from ‘Q1 to Q2’.
Concept introduction:
Demand: Demand refers to the total value of the goods and services that are demanded at a particular price in the given period of time.
Supply: Supply refers to the total value of the goods and services that are available for purchase at a particular price in the given period of time.
Subpart (f):
Demand and supply.
Subpart (f):
Answer to Problem 4P
Price shifts down and quantity indeterminate – f.
Explanation of Solution
If the supply increases with a decrease in demand, it leads to a decrease in the equilibrium price because both the curves put a pressure on the equilibrium price. Thus, an increase in supply increases the equilibrium quantity and a decrease in demand lead to a decrease in the equilibrium quantity. This is shown below in Figure – 6:
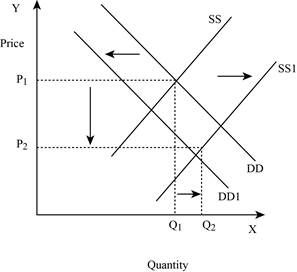
Figure -6
In Figure -6, the horizontal axis measures the quantity supplied and the vertical axis measures the price of the balls. ‘DD’ represents the demand curve and ‘SS’ represents the supply curve. Due to a decrease in demand and an increase in supply, demand curve will shift the curve to the left from DD to DD1. An increase in supply will lead to an increase in the equilibrium quantity from ‘P1 to P2’ and increases the equilibrium quantity from ‘Q1 to Q2’.
Concept introduction:
Demand: Demand refers to the total value of the goods and services that are demanded at a particular price in the given period of time.
Supply: Supply refers to the total value of the goods and services that are available for purchase at a particular price in the given period of time.
Subpart (g):
Demand and supply.
Subpart (g):
Answer to Problem 4P
Price shifts up and quantity indeterminate – g.
Explanation of Solution
If the supply decreases with an increase in demand, it will lead to an increase in the equilibrium price because both the curve put a pressure on the equilibrium price. An increase in demand will lead to an increase in the equilibrium quantity. This is shown below in Figure – 7:
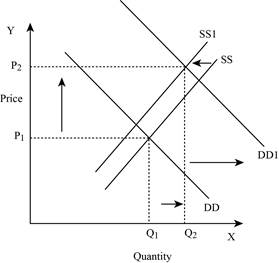
Figure -7
In Figure -7, the horizontal axis measures the quantity supplied and the vertical axis measures the price of the balls. ‘DD’ represents the demand and ‘SS’ represents the supply curve. Due to a decrease in supply and an increase in demand, the supply curve will shift the curve to the left from SS to SS1 and the demand curve shifts the curve to the right, which leads to an increase in the equilibrium price from ‘P1 to P2’ and the equilibrium quantity from ‘Q1 to Q2’.
Concept introduction:
Demand: Demand refers to the total value of the goods and services that are demanded at a particular price in the given period of time.
Supply: Supply refers to the total value of the goods and services that are available for purchase at a particular price in the given period of time.
Subpart (h):
Demand and supply.
Subpart (h):
Answer to Problem 4P
Price indeterminate and quantity shifts down – h.
Explanation of Solution
If both the supply and demand decreases, then it lead to a decrease in the equilibrium quantity and the change in equilibrium price is indeterminate. This is because a decrease in supply puts an upward pressure on the equilibrium price. This is shown below in Figure – 8:
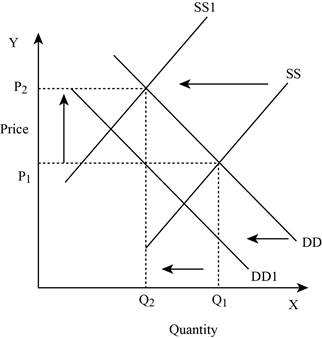
Figure -8
In Figure -8, the horizontal axis measures the quantity supplied and the vertical axis measures the price of the balls. ‘DD’ represents the demand and ‘SS’ represents the supply curve. Due to a decrease in supply and a decrease in demand, the supply curve will shift the curve to the left from SS to SS1 and the demand curve shifts the curve to the left, which lead to an increase in the equilibrium price from ‘P1 to P2’ and a decrease in the equilibrium quantity from ‘Q1 to Q2’.
Concept introduction:
Demand: Demand refers to the total value of the goods and services that are demanded at a particular price in the given period of time.
Supply: Supply refers to the total value of the goods and services that are available for purchase at a particular price in the given period of time.
Want to see more full solutions like this?
Chapter 3 Solutions
Macroeconomics
- not use ai pleasearrow_forward8. The current price of 3M stock is $87 per share. The previous dividend paid was $5.96, and the next dividend is $6.25, assuming a growth rate of 4.86% per year. What is the forward (next 12 months) dividend yield? Show at least two decimal places, as in x.xx% %arrow_forwardJoy's Frozen Yogurt shops have enjoyed rapid growth in northeastern states in recent years. From the analysis of Joy's various outlets, it was found that the demand curve follows this pattern: Q=200-300P+1201 +657-250A +400A; where Q = number of cups served per week P = average price paid for each cup I = per capita income in the given market (thousands) Taverage outdoor temperature A competition's monthly advertising expenditures (thousands) = A; = Joy's own monthly advertising expenditures (thousands) One of the outlets has the following conditions: P = 1.50, I = 10, T = 60, A₁ = 15, A; = 10 1. Estimate the number of cups served per week by this outlet. Also determine the outlet's demand curve. 2. What would be the effect of a $5,000 increase in the competitor's advertising expenditure? Illustrate the effect on the outlet's demand curve. 3. What would Joy's advertising expenditure have to be to counteract this effect?arrow_forward
- The Compute Company store has been selling its special word processing software, Aceword, during the last 10 months. Monthly sales and the price for Aceword are shown in the following table. Also shown are the prices for a competitive software, Goodwrite, and estimates of monthly family income. Calculate the appropriate elasticities, keeping in mind that you can calculate an elasticity measure only when all other factors do not change (using Excel). For example, price elasticities, months 1-2. Month Price Aceword Quantity Aceword Family Income Price Goodwrite 1 $120 200 $4,000 $130 21 120 210 4,000 145 3 120 220 4,200 145 4 110 240 4,200 145 90 5 115 230 4,200 145 6 115 215 4,200 125 10 7899 115 220 4,400 125 105 230 4,400 125 105 235 4,600 125 105 220 4,600 115arrow_forwardGordon Dividend Growth Model I downloaded some data about 3M (ticker MMM). Company 3M Ticker MMM Dividends Per Share 2017 $4.70 2018 $5.44 2019 $5.76 2020 $5.88 2021 $5.92 2022 $5.96 4. The dividend payment in 2022 was $5.96 per share. Based on the five-year history, we see that dividends per share grew at a compound annual growth rate of 4.86% $5.96 (1/5) CAGR = $4.70 − 1 = (1.2681)0.20 − 1 = 1.0486 - 1 = 0.0486 = 4.86% - - What should be the 2023 dividend based on these values?arrow_forward4. The data set BWGHT.DTA contains data on births to women in the United States. Two variables of interest are the dependent variable, infant birth weight in ounces (bwght), and an explanatory variable, average number of cigarettes the mother smoked per day during pregnancy (cigs). The following simple regression was estimated using data on n=1,388 births: bwght=119.77 - .514 cigs (i) What is the predicted birth weight when cigs = 0? What about when cigs=20 (one pack per day)? Comment on the difference. (ii) Does this simple regression necessarily capture a causal relationship between the child's birth weight and the mother's smoking habits? Explain. (iii) To predict a birth weight of 125 ounces, what would cigs have to be? Comment. (iv) The proportion of women in the sample who do not smoke while pregnant is about .85. Does this help reconcile your finding from part (iii)?arrow_forward
- Given the demand equation Q following table (using Excel): = 1,500 200P, calculate all the numbers necessary to fill in the Elasticity P Q Point Arc Total Revenue Revenue Marginal $7.00 6.50 6.00 5.50 5.00 4.50 4.00 3.50 3.00 2.50arrow_forwardSuppose a firm has the following demand equation: where Q = quantity demanded P = product price (in dollars) Q=1,000 3,000P + 10A A = advertising expenditure (in dollars) Assume for the following questions that P =3$ and A = $2,000. 1. Suppose the firm dropped the price to $2.50. Would this be beneficial? Explain. Illustrate your answer with the use of a demand schedule and demand curve. 2. Suppose the firm raised the price to $4.00 while increasing its advertising expenditure by $100. Would this be beneficial? Explain. Illustrate your answer with the use of a demand schedule and a demand curve. (Hint: First construct the schedule and the curve assuming A = $2,000. Then construct the new schedule and curve assuming A = $2,100.)arrow_forwardABC Sports, a store that sells various types of sports clothing and other sports items, is planning to introduce a new design of Arizona Diamondbacks' baseball caps. A consultant has estimated the demand curve to be where Q is cap sales and P is price. Q=2,000 100P 1. How many caps could ABC sell at $6 each? 2. How much would the price have to be to sell 1,800 caps? 3. Suppose ABC were to use the caps as a promotion. How many caps could ABC give away free? 4. At what price would no caps be sold? 5. Calculate the point price elasticity of demand at a price of $6.arrow_forward
- 1. What are the basic information related to the BPO industry in the Philippines? 2. Top 15 BPO industries here in the Philippines. 3. Significance to certain economies. 4. What services are being outsourced?arrow_forwardSelect a real-world case situation relevant to credit analysis and lending in Guyana. Use this case which you either know about already or have identified through research and address the following questions in essay format: i. Outline and discuss what “triggered” the regulatory body to intervene? ii. How effective do you think the response was to such a crisis? iii. Outline and discuss two ways that could be used to strengthen the current regulatory environment?arrow_forwardHome can produce a maximum of 400 apples or a maximum of 600 bananas.Foreign can produce a maximum of 160 apples or a maximum of 800 bananas.(a) Graph and label Homes PPF. Label each axis and the slope. Use numbers.1(b) In the absence of trade, what is Homes autarky price of apples in terms of bananas?(c) Graph and label Foreigns production possibility frontier. Use numbers and label the slope.(d) Graph the world relative supply curve. Use numbers.23. (8 pts - RM) Now suppose world relative demand for apples takes the following form:Demand for apples/demand for bananas - price of bananas/price of apples. That is, RDA = Pbananas Papples(a) Graph the relative demand and relative supply curves on the world market diagram. Use numbers(b) What is the equilibrium (world) relative price of apples? (c) Show that both Home and Foreign gain from Trade and describe the pattern of trade.arrow_forward
 Principles of Economics 2eEconomicsISBN:9781947172364Author:Steven A. Greenlaw; David ShapiroPublisher:OpenStax
 Essentials of Economics (MindTap Course List)EconomicsISBN:9781337091992Author:N. Gregory MankiwPublisher:Cengage Learning
 Principles of Economics (MindTap Course List)EconomicsISBN:9781305585126Author:N. Gregory MankiwPublisher:Cengage Learning
 Principles of Microeconomics (MindTap Course List)EconomicsISBN:9781305971493Author:N. Gregory MankiwPublisher:Cengage Learning
 Principles of Economics, 7th Edition (MindTap Cou...EconomicsISBN:9781285165875Author:N. Gregory MankiwPublisher:Cengage Learning
 Brief Principles of Macroeconomics (MindTap Cours...EconomicsISBN:9781337091985Author:N. Gregory MankiwPublisher:Cengage Learning


