
a.
To explain: The type of graph could be used to explain the relationship between the two variables.
a.
Explanation of Solution
Given:
The data set is:
| Temperature | Percent |
| 13.34 | 4.39 |
| 13.59 | 4.39 |
| 13.66 | 5.63 |
| 13.83 | 6.3 |
| 13.95 | 5.49 |
| 14.01 | 4.1 |
| 14.13 | 4.1 |
| 14.19 | 5.29 |
| 14.24 | 5.1 |
| 14.24 | 4.41 |
| 14.28 | 5.01 |
| 14.37 | 5.8 |
| 14.45 | 4.75 |
| 14.47 | 5.48 |
| 14.53 | 6.09 |
| 14.53 | 5.59 |
| 14.62 | 4.82 |
| 14.69 | 5.12 |
| 14.71 | 5.23 |
| 14.76 | 4.39 |
| 14.82 | 5.81 |
| 14.9 | 5.5 |
| 14.91 | 5.84 |
| 14.92 | 4.36 |
| 15.02 | 4.91 |
| 15.06 | 4.99 |
| 15.09 | 3.7 |
| 15.19 | 6.21 |
| 15.21 | 6.21 |
| 15.22 | 4.1 |
| 15.33 | 4.1 |
| 15.36 | 4.69 |
| 15.4 | 5.6 |
| 15.44 | 3.51 |
| 15.53 | 5.91 |
| 15.56 | 3.99 |
| 15.61 | 3.59 |
| 15.65 | 4.18 |
| 15.8 | 3.8 |
| 15.91 | 3.61 |
| 15.98 | 3.3 |
| 16.02 | 3.8 |
| 16.06 | 3.49 |
| 16.13 | 3.19 |
| 16.14 | 6 |
| 16.22 | 3.5 |
| 16.34 | 2.8 |
| 16.42 | 3.61 |
| 16.71 | 2 |
| 16.74 | 3.5 |
| 16.84 | 3 |
| 17.17 | 3.61 |
| 17.51 | 2.97 |
The
b.
To compare: The analysis for the 2D system with that of 3D system and explain whether 3D program is an improved version over the 2D version.
b.
Explanation of Solution
In this case, temperature is an explanatory variables as it does not get affected by any other variables
Graph:
The scatter plot for the provided variables can be constructed as:
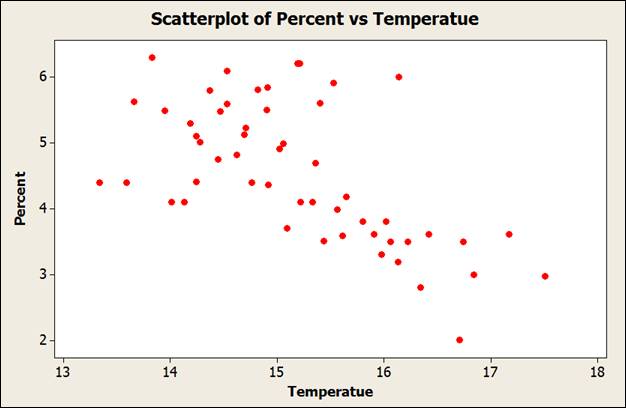
From the scatter plot constructed above,
Direction: There is a negative association between the two variables
Form: There is approximately linear relationship between the variables.
Strength: There is a moderate negative relationship between variables
c.
To find: The numerical value of the correlation, if possible and explain the association using the value of the
c.
Explanation of Solution
The correlation using the mentioned steps of Excel below can be calculated as:
- Enter the data set in the Excel sheet.
- Click on Data > Data Analysis.
- Select “Correlation” from the drop down menu.
- Select input
range . - Click OK.
The obtained output is:
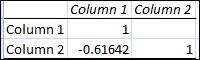
Thus, the correlation coefficient ( r ) is approximately -0.62. Thus, it is confirmed that there is a moderate
Want to see more full solutions like this?
Chapter 3 Solutions
Practice of Statistics in the Life Sciences

 MATLAB: An Introduction with ApplicationsStatisticsISBN:9781119256830Author:Amos GilatPublisher:John Wiley & Sons Inc
 Probability and Statistics for Engineering and th...StatisticsISBN:9781305251809Author:Jay L. DevorePublisher:Cengage Learning
 Statistics for The Behavioral Sciences (MindTap C...StatisticsISBN:9781305504912Author:Frederick J Gravetter, Larry B. WallnauPublisher:Cengage Learning
 Elementary Statistics: Picturing the World (7th E...StatisticsISBN:9780134683416Author:Ron Larson, Betsy FarberPublisher:PEARSON
 The Basic Practice of StatisticsStatisticsISBN:9781319042578Author:David S. Moore, William I. Notz, Michael A. FlignerPublisher:W. H. Freeman
 Introduction to the Practice of StatisticsStatisticsISBN:9781319013387Author:David S. Moore, George P. McCabe, Bruce A. CraigPublisher:W. H. Freeman