Gitman: Principl Manageri Finance_15 (15th Edition) (What's New in Finance)
15th Edition
ISBN: 9780134476315
Author: Chad J. Zutter, Scott B. Smart
Publisher: PEARSON
expand_more
expand_more
format_list_bulleted
Concept explainers
Textbook Question
Chapter 3, Problem 3.25P
Learning Goals 6
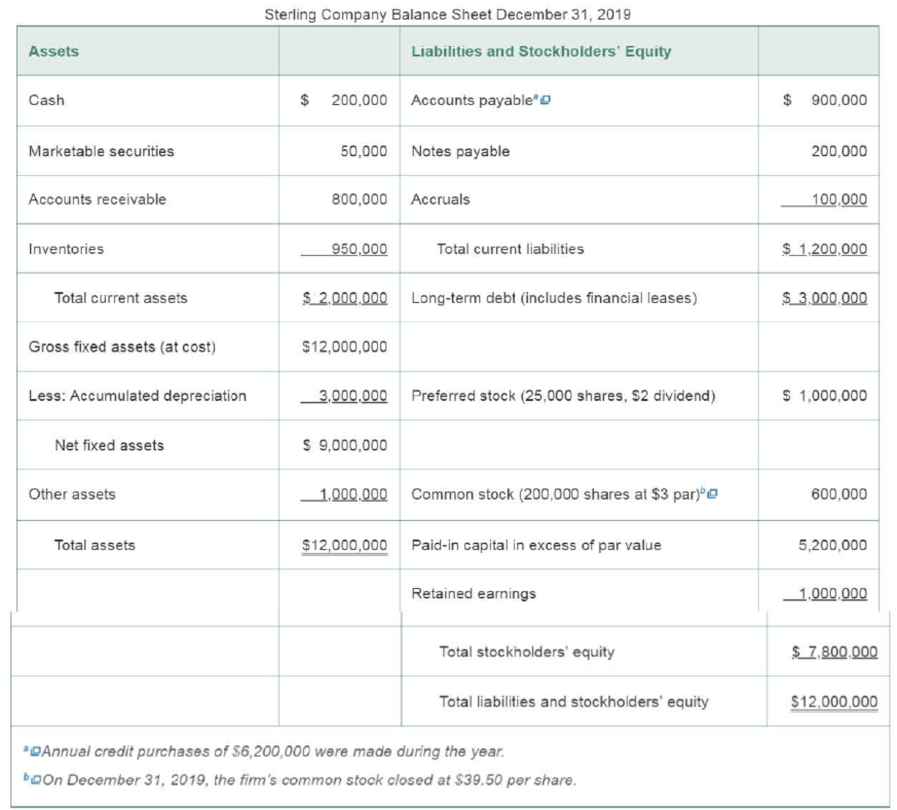
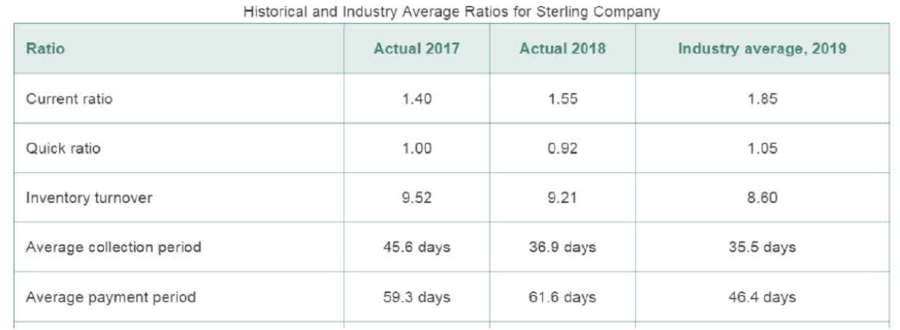
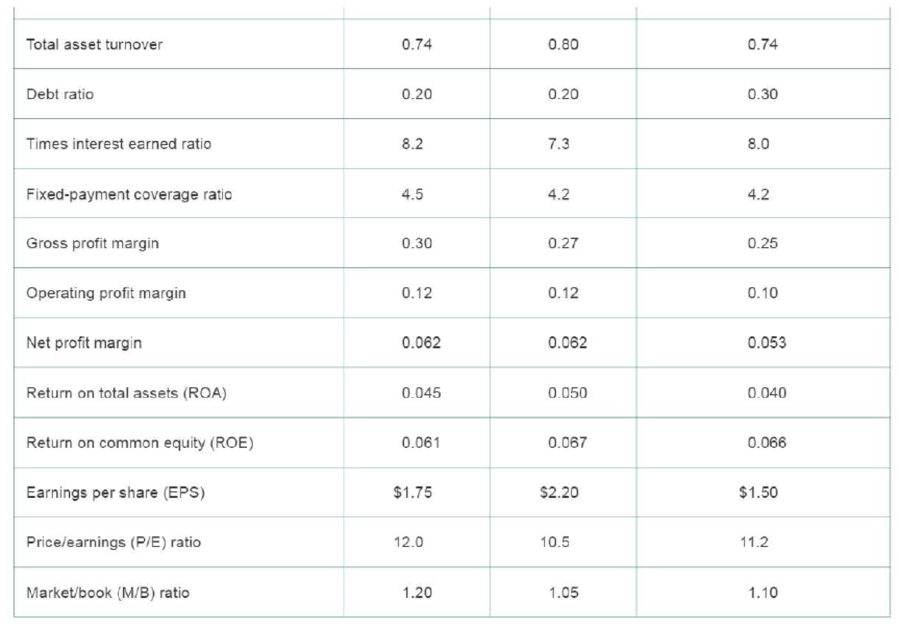
P3- 25 Integrative: Complete ratio analysis Given the following financial statements, historical ratios, and industry averages, calculate Sterling Company's financial ratios for the most recent year. (Assume a 365-day year.)
Sterling Company Income Statement for the Year Ended December 31, 2019
| Sales revenue | $10,000,000 |
| Less: Cost of goods sold | 7,500,000 |
| Gross profits | $2,500,000 |
| Less: Operating expenses | |
| Selling expense | $ 300,000 |
| General and administrative expenses | 650,000 |
| Lease expense | 50,000 |
| 200,000 | |
| Total operating expense | $1,200,000 |
| Operating profits | $1,300,000 |
| Less: Interest expense | 200,000 |
| Net profits before taxes | $ 1,100,000 |
| Less: Taxes (rate = 40%) | 440,000 |
| Net profits after taxes | $ 660,000 |
| Less: |
50,000 |
| Earnings available for common stockholders | $ 610,000 |
| Earnings per share (EPS) | $3.05 |

Analyze its overall financial situation from both a cross-sectional and a time-series viewpoint. Break your analysis into evaluations of the firm's liquidity, activity, debt, profitability, and market.


Expert Solution & Answer
Want to see the full answer?
Check out a sample textbook solution
Students have asked these similar questions
ng
Equipment is worth $998,454. It is expected to produce regular cash flows of $78,377 per year for 20 years and a special cash flow of
$34,800 in 20 years. The cost of capital is X percent per year and the first regular cash flow will be produced in 1 year. What is X?
Input instructions: Input your answer as the number that appears before the percentage sign. For example, enter 9.86 for 9.86% (do
not enter .0986 or 9.86%). Round your answer to at least 2 decimal places.
percent
3 years ago, you invested $6,700. In 5 years, you expect to have $12,201. If you expect to earn the same annual return after 5 years from today as the annual return implied from the past and expected values given in the problem, then in how many years from today do you expect to have $25,254?
4 years ago, you invested $3,600. In 2 years, you expect to have $7,201. If you expect to earn the same annual return after 2 years
from today as the annual return implied from the past and expected values given in the problem, then in how many years from today
do you expect to have $10,022?
Input instructions: Round your answer to at least 2 decimal places.
years
Chapter 3 Solutions
Gitman: Principl Manageri Finance_15 (15th Edition) (What's New in Finance)
Ch. 3.1 - Prob. 3.1RQCh. 3.1 - Describe the purpose of each of the four major...Ch. 3.1 - Prob. 3.3RQCh. 3.1 - Prob. 3.4RQCh. 3.2 - With regard to financial ratio analysis, how do...Ch. 3.2 - What is the difference between cross-sectional and...Ch. 3.2 - Prob. 3.7RQCh. 3.2 - Prob. 3.8RQCh. 3.3 - Under what circumstances would the current ratio...Ch. 3.3 - In Table 3.5, most of the specific firms listed...
Ch. 3.4 - To assess the firms average collection period and...Ch. 3.5 - What is financial leverage?Ch. 3.5 - What ratio measures the firms degree of...Ch. 3.6 - What three ratios of profitability appear on a...Ch. 3.6 - Prob. 3.15RQCh. 3.6 - Prob. 3.16RQCh. 3.7 - What do the price/earnings (P/E) ratio and the...Ch. 3.8 - Financial ratio analysis is often divided into...Ch. 3.8 - Prob. 3.19RQCh. 3.8 - What three areas of analysis are combined in the...Ch. 3 - For the quarter ended January 28, 2017, Kroger...Ch. 3 - Learning Goals 3, 4, 5 ST3-1 Ratio formulas and...Ch. 3 - Prob. 3.2STPCh. 3 - Prob. 3.1WUECh. 3 - Learning Goal 1 E3-2 Explain why the income...Ch. 3 - Prob. 3.3WUECh. 3 - Learning Goal 3 E3-4 Bluestone Metals Inc. is a...Ch. 3 - Learning Goal 6 E3-5 If we know that a firm has a...Ch. 3 - Financial statement account identification Mark...Ch. 3 - Learning Goal 1 P3-2 1ncome statement preparation...Ch. 3 - Prob. 3.3PCh. 3 - Learning Goal 1 P3-4 Calculation of EPS and...Ch. 3 - Prob. 3.5PCh. 3 - Prob. 3.6PCh. 3 - Learning Goals 1 P3-7 Initial sale price of common...Ch. 3 - Prob. 3.8PCh. 3 - Learning Goal 1 P3-9 Changes In stockholders...Ch. 3 - Learning Goals 2, 3, 4, 5 P3-10 Ratio comparisons...Ch. 3 - Learning Goal 3 P3-11 Liquidity management Bauman...Ch. 3 - Prob. 3.12PCh. 3 - Inventory management Three companies that compete...Ch. 3 - Accounts receivable management The table below...Ch. 3 - Prob. 3.15PCh. 3 - Learning Goal 4 P3-16 Debt analysis Springfield...Ch. 3 - Prob. 3.17PCh. 3 - Learning Goals 2, 3, 4 P3-18 Using Tables 3.1,...Ch. 3 - Learning Goals 5 P3-19 Common-size statement...Ch. 3 - The relationship between financial leverage and...Ch. 3 - Learning Goal 4 P3-21 Analysis of debt ratios...Ch. 3 - Learning Goal 6 P3-22 Ratio proficiency McDougal...Ch. 3 - Learning Goal 6 P3-23 Cross-sectional ratio...Ch. 3 - Learning Goal 6 P3-24 Financial statement analysis...Ch. 3 - Learning Goals 6 P3- 25 Integrative: Complete...Ch. 3 - Learning Goal 6 P3-26 DuPont system of analysis...Ch. 3 - Learning Goal 6 P3-27 Complete ratio analysis,...Ch. 3 - Spreadsheet Exercise The income statement and...
Knowledge Booster
Learn more about
Need a deep-dive on the concept behind this application? Look no further. Learn more about this topic, finance and related others by exploring similar questions and additional content below.Similar questions
- Since ROE can sometimes be boosted artificially through financial leverage, do you think it would be more beneficial for investors to rely on a combination of ROE and other financial health indicators, such as the debt-to-equity ratio or interest coverage ratio, when assessing a stock's long-term potential?arrow_forwardGiven that Merck and Pfizer both face revenue risks from patent expirations, how do you think financial managers at these companies should adjust their capital structure to maintain stability and investor confidence?arrow_forwardDon't used hand raiting and don't used Ai solutionarrow_forward
- John works for a fixed income hedge fund. Your fund invests in $100 million in mortgage-backed-bonds (MBS) with a duration of 10. He finances these bonds with $2 million in investor capital and $98 million of overnight repurchase agreements (required haircut=2%) with an interest rate of 1%. After hours, negative news comes out on the evening news that increases yields on MBS by 25 basis points. Moreover, effective tomorrow, because of this bad news, repurchase agreement lenders will now require a haircut of 3% to lend to you via repurchase agreements with your MBS as collateral. Assuming he receives no interest payments from your MBS, how much cash does he need to not default on today’s repurchase agreement and to keep the position open for one more day tomorrow? Please provide calculations in excel.arrow_forward220 6-1. (Expected return and risk) Universal Corporation is planning to invest in a secu- LO1 LO2 rity that has several possible rates of return. Given the following probability distribu- tion of returns, what is the expected rate of return on the investment? Also, compute the standard deviations of the returns. What do the resulting numbers represent? PROBABILITY 0.10 0.20 0.30 RETURN -10% 5% 0.40 10% 25% 6-2. (Average expected return and risk) Given the holding-period returns shown here, calculate the average returns and the standard deviations for the Kaifu Corporation Myb and for the market. MONTH 1 2 3 KAIFU CORP. 4% 6% 0% 2% MARKET 2% 3% 1% -1% 6-3. (Expected rate of return and risk) Carter, Inc. is evaluating a security. Calculate the investment's expected return and its standard deviation. PROBABILITY 0.15 RETURN 6% 0.30 9% 0.40 10% 0.15 15% PART 2 The Valuation of Financial Assets 6-4. (Expected rate of return and risk) Summerville, Inc. is considering an investment in one of…arrow_forward6-14. (Expected return, standard deviation, and capital asset pricing model) The following LO5 are the end-of-month prices for both the Standard & Poor's 500 Index and Nike's common stock. a. Using the data here, calculate the holding-period returns for each of the months. NIKE S&P 500 INDEX 2017 January $52.90 $2,279 February 57.16 2,364 March 55.73 2,363 April 55.41 2,384 May 52.99 2,412 June 59.00 2,423 July 59.05 2,470 August 52.81 2,472 September 51.85 2,519 October 54.99 2,575 November 60.42 2,648 December 62.55 2,674 2018 January 68.22 2,824 b. Calculate the average monthly return and the standard deviation for both the S&P 500 and Nike. 222 PART 2 • The Valuation of Financial Assets c. Develop a graph that shows the relationship between the Nike stock returns and the S&P 500 Index. (Show the Nike returns on the vertical axis and the S&P 500 Index returns on the horizontal axis as done in Figure 6-5.) d. From your graph, describe the nature of the relationship between Nike stock…arrow_forward
- required rates of return for the three securities? 6-23. (Portfolio beta and security market line) You own a portfolio consisting of the ☑ stocks below: PERCENTAGE OF STOCK OR SECURITY PORTFOLIO BETA EXPECTED RETURN 1 20% 1.00 12% 2 30% 0.85 8% 3 15% 1.20 12% 25% 0.60 7% 5 10% 1.60 16% The risk-free rate is 3 percent. Also, the expected return on the market portfolio is 11 percent. a. Calculate the expected return of your portfolio. (Hint: The expected return of a portfolio equals the weighted average of the individual stocks' expected returns, where the weights are the percentage invested in each stock.) b. Calculate the portfolio beta. c. Given the foregoing information, plot the security market line on paper. Plot the stocks from your portfolio on your graph. d. From your plot in part (c), which stocks appear to be your winners and which ones appear to be your losers? e. Why should you consider your conclusion in part (d) to be less than certain? 6-24. (Portfolio beta) Assume you…arrow_forwardWizzy Wigs is an unleveraged firm with $80 million in total assets, 2 million shares outstanding, and $15 million in EBIT. The shares price is $40, tax adjusted cost of debt 4.61%, and corporate tax rate of 21%. What are the returns on equity (ROEs) for the firm if it shifts to a 0.75 debt-to-equity ratio and for an individual with 700 shares who created homemade leverage at the same DE ratio? ◻ firm 25.61%; inv. 24.99% firm 18.24%; inv. 19.46% firm 38.59%; inv. 35.53% firm 23.19%; inv. 22.46% firm 30.07%; inv. 30.19% Please show work on excel spreadsheetarrow_forwardYou are running a hot Internet company. Analysts predict that its earnings will grow at 20% per year for the next 9 years. After that, as competition increases, earnings growth is expected to slow to 4% per year and continue at that level forever. Your company has just announced earnings of $4 million. What is the present value of all future earnings if the interest rate is 9%? (Assume all cash flows occur at the end of the year.) The present value of all future earnings is million. (Round to two decimal places.)arrow_forward
- 3. Losses for an insurance company next year are estimated to be 100 million with standard deviation 250 million. Using lognormal and two-parameter Pareto distributions to obtain the VaR at the 95%, 97.5%, 99% security levels. Comment on your findings.arrow_forwardA company sold 4 million shares in its IPO, at a priceof $18.50 per share. Management negotiated a fee(the underwriting spread) of 7% on this transaction.What was the dollar cost of this fee?arrow_forwardConsider the following three bonds (see Table 1), which all have a par value of $100 and pay coupons semiannually if the coupon rate is not zero. What is the 6.5-year spot rate on a BEY basis? Bond Coupon Rate Price Maturity(yrs) A 106 3 6 75 B 0 6 115 C 4 6.5arrow_forward
arrow_back_ios
SEE MORE QUESTIONS
arrow_forward_ios
Recommended textbooks for you
 Cornerstones of Financial AccountingAccountingISBN:9781337690881Author:Jay Rich, Jeff JonesPublisher:Cengage Learning
 Survey of Accounting (Accounting I)AccountingISBN:9781305961883Author:Carl WarrenPublisher:Cengage Learning
 Managerial Accounting: The Cornerstone of Busines...AccountingISBN:9781337115773Author:Maryanne M. Mowen, Don R. Hansen, Dan L. HeitgerPublisher:Cengage Learning

Cornerstones of Financial Accounting
Accounting
ISBN:9781337690881
Author:Jay Rich, Jeff Jones
Publisher:Cengage Learning

Survey of Accounting (Accounting I)
Accounting
ISBN:9781305961883
Author:Carl Warren
Publisher:Cengage Learning

Managerial Accounting: The Cornerstone of Busines...
Accounting
ISBN:9781337115773
Author:Maryanne M. Mowen, Don R. Hansen, Dan L. Heitger
Publisher:Cengage Learning
The KEY to Understanding Financial Statements; Author: Accounting Stuff;https://www.youtube.com/watch?v=_F6a0ddbjtI;License: Standard Youtube License