
Concept explainers
Videos
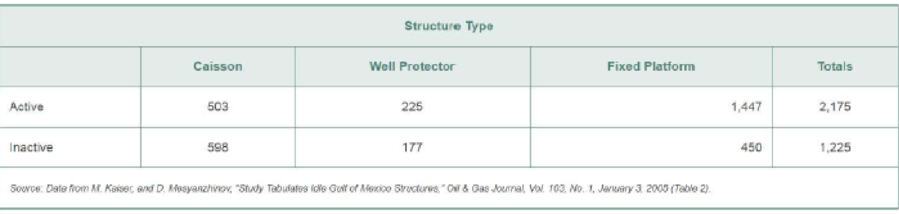
Inactive oil and gas structures. U.S. federal regulations require that operating companies clear all inactive offshore oil and gas structures within 1 year after production ceases. Researchers at the Louisiana State University Center for Energy Studies gathered data on both active and inactive oil and gas structures in the Gulf of Mexico (Oil & Gas Journal, Jan. 3, 2005). They discovered that the Gulf of Mexico has 2,175 active and 1,225 idle (inactive) structures. The following table breaks down these structures by type (caisson, well protector, or fixed platform). Consider the structure type and active status of one of these oil/gas structures.
- a. List the simple
events for this experiment. - b. Assign reasonable probabilities to the simple events.
- c. Find the
probability that the structure is active. - d. Find the probability that the structure is a well protector.
- e. Find the probability that the structure is an inactive caisson.
- f. Find the probability that the structure is either inactive or a fixed platform.
- g. Find the probability that the structure is not a caisson.
Want to see the full answer?
Check out a sample textbook solution
Chapter 3 Solutions
EP STATISTICS F/BUS.+ECON.-ACCESS 18 WK
Additional Math Textbook Solutions
Statistical Reasoning for Everyday Life (5th Edition)
Elementary Statistics
An Introduction to Mathematical Statistics and Its Applications (6th Edition)
Elementary Statistics: Picturing the World (6th Edition)
Essential Statistics
Probability and Statistics for Engineering and the Sciences


- Cholesterol Cholesterol in human blood is necessary, but too much can lead to health problems. There are three main types of cholesterol: HDL (high-density lipoproteins), LDL (low-density lipoproteins), and VLDL (very low-density lipoproteins). HDL is considered “good” cholesterol; LDL and VLDL are considered “bad” cholesterol. A standard fasting cholesterol blood test measures total cholesterol, HDL cholesterol, and triglycerides. These numbers are used to estimate LDL and VLDL, which are difficult to measure directly. Your doctor recommends that your combined LDL/VLDL cholesterol level be less than 130 milligrams per deciliter, your HDL cholesterol level be at least 60 milligrams per deciliter, and your total cholesterol level be no more than 200 milligrams per deciliter. (a) Write a system of linear inequalities for the recommended cholesterol levels. Let x represent the HDL cholesterol level, and let y represent the combined LDL VLDL cholesterol level. (b) Graph the system of inequalities from part (a). Label any vertices of the solution region. (c) Is the following set of cholesterol levels within the recommendations? Explain. LDL/VLDL: 120 milligrams per deciliter HDL: 90 milligrams per deciliter Total: 210 milligrams per deciliter (d) Give an example of cholesterol levels in which the LDL/VLDL cholesterol level is too high but the HDL cholesterol level is acceptable. (e) Another recommendation is that the ratio of total cholesterol to HDL cholesterol be less than 4 (that is, less than 4 to 1). Identify a point in the solution region from part (b) that meets this recommendation, and explain why it meets the recommendation.arrow_forwardOil ProductionThe following table shows the amount of crude oil in billions of barrels produced in the United States in recent years. Source: U.S. Energy Information Administration. Year Crude Oil Produced 2002 2.097 2003 2.060 2004 1.989 2005 1.893 2006 1.857 2007 1.853 2008 1.830 2009 1.954 2010 2.000 2011 2.063 2012 2.377 In this exercise we are interested in the total amount of crude oil produced over the 10-year period from mid-2002 to mid-2012, using the data for the 11 years above. One approach is to sum up the numbers in the second column, but only count half of the first and last numbers. Give the answer to this calculation. Approximate the amount of crude oil produced over the 10-year period 2002-2012 by taking the average of the left endpoint sum and the right endpoint sum. Explain why this is equivalent to the calculation done in part a. This is also equivalent to a formula known as the trapezoidal rule, discussed in the next chapter. If your calculator has a cubic regression feature, find the best-fitting cubic function for these data, letting t=0 correspond to 2000. Then integrate this equation over the interval [2.12] to estimate the amount of crude oil produced over this time period. Compare with your answer to part a.arrow_forward

 Calculus For The Life SciencesCalculusISBN:9780321964038Author:GREENWELL, Raymond N., RITCHEY, Nathan P., Lial, Margaret L.Publisher:Pearson Addison Wesley,