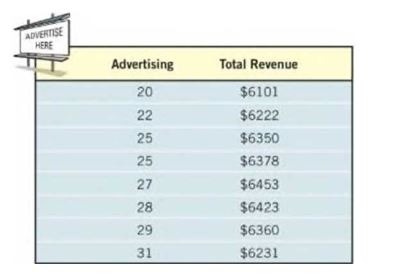
29. Advertising A small manufacturing firm collected the following data on advertising expenditures A (in thousands of dollars) and total revenue R (in thousands of dollars). (a) Draw a scatter diagram of the data. Comment on the type of relation that may exist between the two variables. (b) The quadratic function of best fit to these data is R ( A ) = − 7.76 A 2 + 411.88 A + 942.72 Use this function to determine the optimal level of advertising. (c) Use the function to predict the total revenue when the optimal level of advertising is spent. (d) Use a graphing utility to verify that the function given in part (b) is the quadratic function of best fit. (e) Use a graphing utility to draw a scatter diagram of the data and then graph the quadratic function of best fit on the scatter diagram.
29. Advertising A small manufacturing firm collected the following data on advertising expenditures A (in thousands of dollars) and total revenue R (in thousands of dollars). (a) Draw a scatter diagram of the data. Comment on the type of relation that may exist between the two variables. (b) The quadratic function of best fit to these data is R ( A ) = − 7.76 A 2 + 411.88 A + 942.72 Use this function to determine the optimal level of advertising. (c) Use the function to predict the total revenue when the optimal level of advertising is spent. (d) Use a graphing utility to verify that the function given in part (b) is the quadratic function of best fit. (e) Use a graphing utility to draw a scatter diagram of the data and then graph the quadratic function of best fit on the scatter diagram.
Solution Summary: The author explains how to calculate the optimum level of advertising using the quadratic function of best fit.
29. Advertising A small manufacturing firm collected the following data on advertising expenditures A (in thousands of dollars) and total revenue R (in thousands of dollars).
(a) Draw a scatter diagram of the data. Comment on the type of relation that may exist between the two variables.
(b) The quadratic function of best fit to these data is
Use this function to determine the optimal level of advertising.
(c) Use the function to predict the total revenue when the optimal level of advertising is spent.
(d) Use a graphing utility to verify that the function given in part (b) is the quadratic function of best fit.
(e) Use a graphing utility to draw a scatter diagram of the data and then graph the quadratic function of best fit on the scatter diagram.
Formula Formula A polynomial with degree 2 is called a quadratic polynomial. A quadratic equation can be simplified to the standard form: ax² + bx + c = 0 Where, a ≠ 0. A, b, c are coefficients. c is also called "constant". 'x' is the unknown quantity
Need a deep-dive on the concept behind this application? Look no further. Learn more about this topic, calculus and related others by exploring similar questions and additional content below.


 Calculus For The Life SciencesCalculusISBN:9780321964038Author:GREENWELL, Raymond N., RITCHEY, Nathan P., Lial, Margaret L.Publisher:Pearson Addison Wesley,
 Functions and Change: A Modeling Approach to Coll...AlgebraISBN:9781337111348Author:Bruce Crauder, Benny Evans, Alan NoellPublisher:Cengage Learning
 Algebra & Trigonometry with Analytic GeometryAlgebraISBN:9781133382119Author:SwokowskiPublisher:Cengage