
Macroeconomics
20th Edition
ISBN: 9781308149929
Author: McGraw-Hill
Publisher: MCG/CREATE
expand_more
expand_more
format_list_bulleted
Question
Chapter 3, Problem 2P
Subparts (a):
To determine
The quantity supplied.
Given information:
Figure 1 shows the Supply curve ‘S1’ for tennis balls:
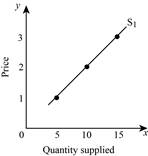
Table -1 shows the quantity supplied (S1 and S2) and its changes:
| Price |
‘S1’ Quantity supplied | ‘S2’ Quantity supplied | Change in quantity supplied |
| 3 | - | 4 | - |
| 2 | - | 2 | - |
| 1 | - | 0 | - |
Subparts (b):
To determine
The quantity supplied.
Given information:
Figure 1 shows the Supply curve ‘S1’ for tennis balls:
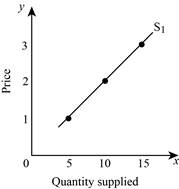
Table -1 shows the quantity supplied (S1 and S2) and its changes:
| Price |
‘S1’ Quantity supplied | ‘S2’ Quantity supplied | Change in quantity supplied |
| 3 | - | 4 | - |
| 2 | - | 2 | - |
| 1 | - | 0 | - |
Subparts (c):
To determine
The quantity supplied.
Given information:
Figure 1 shows the Supply curve ‘S1’ for tennis balls:

Table -1 shows the quantity supplied (S1 and S2) and its changes:
| Price |
‘S1’ Quantity supplied | ‘S2’ Quantity supplied | Change in quantity supplied |
| 3 | - | 4 | - |
| 2 | - | 2 | - |
| 1 | - | 0 | - |
Subparts (d):
To determine
The quantity supplied.
Given information:
Figure 1 shows the Supply curve ‘S1’ for tennis balls:

Table -1 shows the quantity supplied (S1 and S2) and its changes:
| Price |
‘S1’ Quantity supplied | ‘S2’ Quantity supplied | Change in quantity supplied |
| 3 | - | 4 | - |
| 2 | - | 2 | - |
| 1 | - | 0 | - |
Expert Solution & Answer

Trending nowThis is a popular solution!

Students have asked these similar questions
The figure below shows the supply curve for tennis balls, S, for Drop Volley Tennis, a producer of tennis equipment. Use the figure
and the table below to give your answers to the following questions.
4
1
10
15
20
Quantity supplied
a. Use the figure to fill in the quantity supplied given supply curve S, for each price in the following table (second column, gray-shaded
cells).
Instructions: If you are entering any negative numbers be sure to include a negative sign (-) in front of those numbers.
S1 Quantity
Supplied
S2 Quantity
Supplied
Change in Quantity
Supplied
Price
$
3
4
2
1
b. If production costs were to increase, the quantities supplied at each price would be as shown by the third column of the table ("S,
Quantity Supplied"). Use those data to draw supply curve S, using the graph below.
Instructions: On the graph below, use your mouse to click and drag supply curve S, as necessary, or you may move the individual
points.
5
4
3
s,
1
5
10
15
20
Quantity supplied
c. In the fourth…
The figure below shows the supply curve for tennis balls, S1, for Drop Volley Tennis, a producer of tennis equipment. Use the figure and the table below to give your answers to the following questions. a. Use the figure to fill in the quantity supplied on supply urve S1 for each price in the following table. b. If production costs were to increase, the quantities supplied at each price would be as shown by the third column of the table (“S2 Quantity Supplied”). Use those data to draw supply curve S2 on the same graph as supply curve S1. c. In the fourth column of the table, enter the amount by which the quantity supplied at each price changes due to the increase in product costs. (Use positive numbers for increases and negative numbers for decreases.) d. Did the increase in production costs cause a “decrease in supply” or a “decrease in quantity supplied”?
using the graph below and the following statement, determine whether there has been a change in supply or a change in quantity supplied. draw a demand-and-supply diagram for each situation to sho either a movement along the supply curve or a shift of the supply curve.
a) the price of canadian-grown peaches plummets during an unusually warm summer that increases the size of the peach harvest. in the graph, please show either a movement along the supply curve by drawing a new point along the supply curve or a shift of the supply curve by drawing a new line and also label them please.
Chapter 3 Solutions
Macroeconomics
Ch. 3.A - Prob. 1ADQCh. 3.A - Prob. 2ADQCh. 3.A - Prob. 3ADQCh. 3.A - Prob. 4ADQCh. 3.A - Prob. 5ADQCh. 3.A - Prob. 6ADQCh. 3.A - Prob. 7ADQCh. 3.A - Prob. 1ARQCh. 3.A - Prob. 2ARQCh. 3.A - Prob. 3ARQ
Ch. 3.A - Prob. 4ARQCh. 3.A - Prob. 5ARQCh. 3.A - Prob. 6ARQCh. 3.A - Prob. 1APCh. 3.A - Prob. 2APCh. 3.A - Prob. 3APCh. 3.6 - Prob. 1QQCh. 3.6 - Prob. 2QQCh. 3.6 - Prob. 3QQCh. 3.6 - Prob. 4QQCh. 3 - Prob. 1DQCh. 3 - Prob. 2DQCh. 3 - Prob. 3DQCh. 3 - Prob. 4DQCh. 3 - Prob. 5DQCh. 3 - Prob. 6DQCh. 3 - Prob. 7DQCh. 3 - Prob. 8DQCh. 3 - Prob. 1RQCh. 3 - Prob. 2RQCh. 3 - Prob. 3RQCh. 3 - Prob. 4RQCh. 3 - Prob. 5RQCh. 3 - Prob. 6RQCh. 3 - Prob. 7RQCh. 3 - Prob. 8RQCh. 3 - Prob. 9RQCh. 3 - Prob. 1PCh. 3 - Prob. 2PCh. 3 - Prob. 3PCh. 3 - Prob. 4PCh. 3 - Prob. 5PCh. 3 - Prob. 6PCh. 3 - Prob. 7P
Knowledge Booster

Similar questions
- The following table summarizes information about the market for principles of economics textbooks: Price Quantity Demanded per Year Quantity Supplied per Year $45 4,300 300 55 2,300 700 65 1,300 1,300 75 800 2,100 85 650 3,100 What is the market equilibrium price and quantity of textbooks? To quell outrage over tuition increases, the college places a $55 limit on the price of textbooks. How many textbooks will be sold now? While the price limit is still in effect, automated publishing increases the efficiency of textbook production. Show graphically the likely effect of this innovation on the market price and quantity.arrow_forwardThe computer market in recent years has seen many more computing sell at much lower prices. What shift in demand or supply is most likely to explain this outcome? Sketch a demand and supply diagram and explain your reasoning for each. A rise in demand A fall in demand A rise in supply A fall in supplyarrow_forwardWhat is the difference between the supply and the quantity supplied of a product, say milk? Explain in words and show the difference on a graph with the supply curve for milk.arrow_forward
- Use the four-step process to analyze the impact of a Deduction in tariffs on imports of iPods on the equilibrium price and quantity of Sony Walkman-type products.arrow_forwardIn an analysis of the market for paint, an economist discovers the facts listed below. State whether each of these changes will affect supply or demand, and in what direction. There have recently been some important cost-saving inventions in the technology for making paint. Paint is lasting longer so that property owners need not repaint as often. Because of severe hailstorms, many people need to repaint now. The hailstorms damaged several factories that make paint, forcing them to close down for several months.arrow_forwardMany changes are affecting the market for oil. Predict how each of the following events will affect the equilibrium price and quantity in the market for oil. In each case, state how the event will affect the supply and demand diagram. Create a sketch of the diagram if necessary. Cars are becoming more fuel efficient, and therefore get more miles to the gallon. The winter is exceptionally cold. A major discovery of new oil is made off the coast of Norway. The economies of some major oil-using nations, like Japan, slow down. A war in the Middle East disrupts oil-pumping schedules. Landlords install additional insulation in buildings. The price of solar energy falls dramatically. Chemical companies invent a new, popular kind of plastic made from oil.arrow_forward
- Name some factors that can cause a shift in line demand curve in markets for goods and services.arrow_forwardBriefly explain whether each of the following represents a shift in supply or a change in quantity supplied. Use a graph to illustrate your answer. An increase in the use of corn in the production of ethanol has raised the cost of corn to farmers who use it as livestock feed. Speculators in world steel markets push the price of steel up, leading American steel companies to expand production.arrow_forwardSolve the attachmentarrow_forward
- Which of the following graphs shows what will happen to the supply curve for luxury SUVs, if economists predict an increase in demand for these vehicles? Select the correct answer based on the graph (photo) Graph B Graph D Graph A Graph Carrow_forward4. Working with Numbers and Graphs Q4 The following graph shows a market supply curve in orange and a market demand curve in blue. Suppose there is an increase in demand and an increase in supply. Adjust the following graph to reflect the new market conditions. Then, answer the questions that follow. PRICE 10 9 7 2 0 01 2 3 4 5 QUANTITY 6 7 Supply Demand 8 9 10 O Demand Supplyarrow_forwardThe following graph shows the market for pianos in 2009. Between 2009 and 2010, the equilibrium quantity of pianos remained constant, but the and the equilibrium price of pianos decreased. From this, you can conclude that between 2009 and 2010, the supply of pianos demand for pianos Adjust the graph to illustrate your answer by showing the positions of the supply and demand curves in 2010. Note: Select and drag one or both of the curves to the desired position. Curves will snap into position, so if you try to move a curve and it snaps back to its original position, just drag it a little farther. Supply Demand Supply Demand QUANTITY (Pianos) PRICE (Dollars per piano)arrow_forward
arrow_back_ios
SEE MORE QUESTIONS
arrow_forward_ios
Recommended textbooks for you
 Exploring EconomicsEconomicsISBN:9781544336329Author:Robert L. SextonPublisher:SAGE Publications, Inc
 Microeconomics: Private and Public Choice (MindTa...EconomicsISBN:9781305506893Author:James D. Gwartney, Richard L. Stroup, Russell S. Sobel, David A. MacphersonPublisher:Cengage Learning
 Economics: Private and Public Choice (MindTap Cou...EconomicsISBN:9781305506725Author:James D. Gwartney, Richard L. Stroup, Russell S. Sobel, David A. MacphersonPublisher:Cengage Learning
 Principles of Economics 2eEconomicsISBN:9781947172364Author:Steven A. Greenlaw; David ShapiroPublisher:OpenStax
 Microeconomics: Principles & PolicyEconomicsISBN:9781337794992Author:William J. Baumol, Alan S. Blinder, John L. SolowPublisher:Cengage Learning
 Principles of MicroeconomicsEconomicsISBN:9781305156050Author:N. Gregory MankiwPublisher:Cengage Learning
Exploring Economics
Economics
ISBN:9781544336329
Author:Robert L. Sexton
Publisher:SAGE Publications, Inc
Microeconomics: Private and Public Choice (MindTa...
Economics
ISBN:9781305506893
Author:James D. Gwartney, Richard L. Stroup, Russell S. Sobel, David A. Macpherson
Publisher:Cengage Learning
Economics: Private and Public Choice (MindTap Cou...
Economics
ISBN:9781305506725
Author:James D. Gwartney, Richard L. Stroup, Russell S. Sobel, David A. Macpherson
Publisher:Cengage Learning
Principles of Economics 2e
Economics
ISBN:9781947172364
Author:Steven A. Greenlaw; David Shapiro
Publisher:OpenStax
Microeconomics: Principles & Policy
Economics
ISBN:9781337794992
Author:William J. Baumol, Alan S. Blinder, John L. Solow
Publisher:Cengage Learning
Principles of Microeconomics
Economics
ISBN:9781305156050
Author:N. Gregory Mankiw
Publisher:Cengage Learning